```{r}
x <- 2
```Quarto Dashboards, Part 1
This week, we’re taking the visualization skills we learned last week and using them to create an informational dashboard. Quarto dashboards were integrated into version 1.4, so you can use a familiar tool to create these dashboards. In Part 1, we will focus on creating “static” dashboards—where the user does not interact with the content.
Step 1 - What is a Quarto dashboard?
Required-videoRequired Video
- Slides for this Video: https://mine.quarto.pub/quarto-dashboards/1-hello-dashboards/
- Starter Documents: https://github.com/mine-cetinkaya-rundel/olympicdash/blob/main/olympicdash-r-1.qmd
Check-inCheck In
To make a Quarto dashboard what do you put in the
formatline of your YAML?If you use the default options for a Quarto dashboard and your code makes two plots, how will they be output?
- Stacked horizontally (side-by-side)
- Stacked vertically
- How would you define a card title in an R code chunk?
Step 2 - How do you make a Quarto dashboard?
Required-videoRequired Video
- Slides for this Video: https://mine.quarto.pub/quarto-dashboards/2-dashboard-components/
- Starter Documents: https://github.com/mine-cetinkaya-rundel/olympicdash/blob/main/olympicdash-r-2.qmd
Check-inCheck In
- In a Quarto dashboard what does a
#create?
- A new column
- A new row
- A new page
Suppose your Quarto dashboard has a YAML that looks something like this:
---
title: "Olympic Games"
format:
  dashboard:
    orientation: columns
---- With this YAML, what does a
##create?
- A new column
- A new row
- A new page
- What does a
###create?
- A new column
- A new row
- A new page
- How do you change the size of a row? Of a column?
Can different pages of a Quarto dashboard use different orientations? Meaning, can one page use a row orientation and another page use a column orientation?
Which of the following cells will become a card in a dashboard?
```{r}
plot(cars)
```
```{r}
#| output: false
2 + 2
``````{r}
library(palmerpenguins)
```- How do you create a card outside of an R script? Meaning, how would you create a card in Quarto?
History of Dashboards
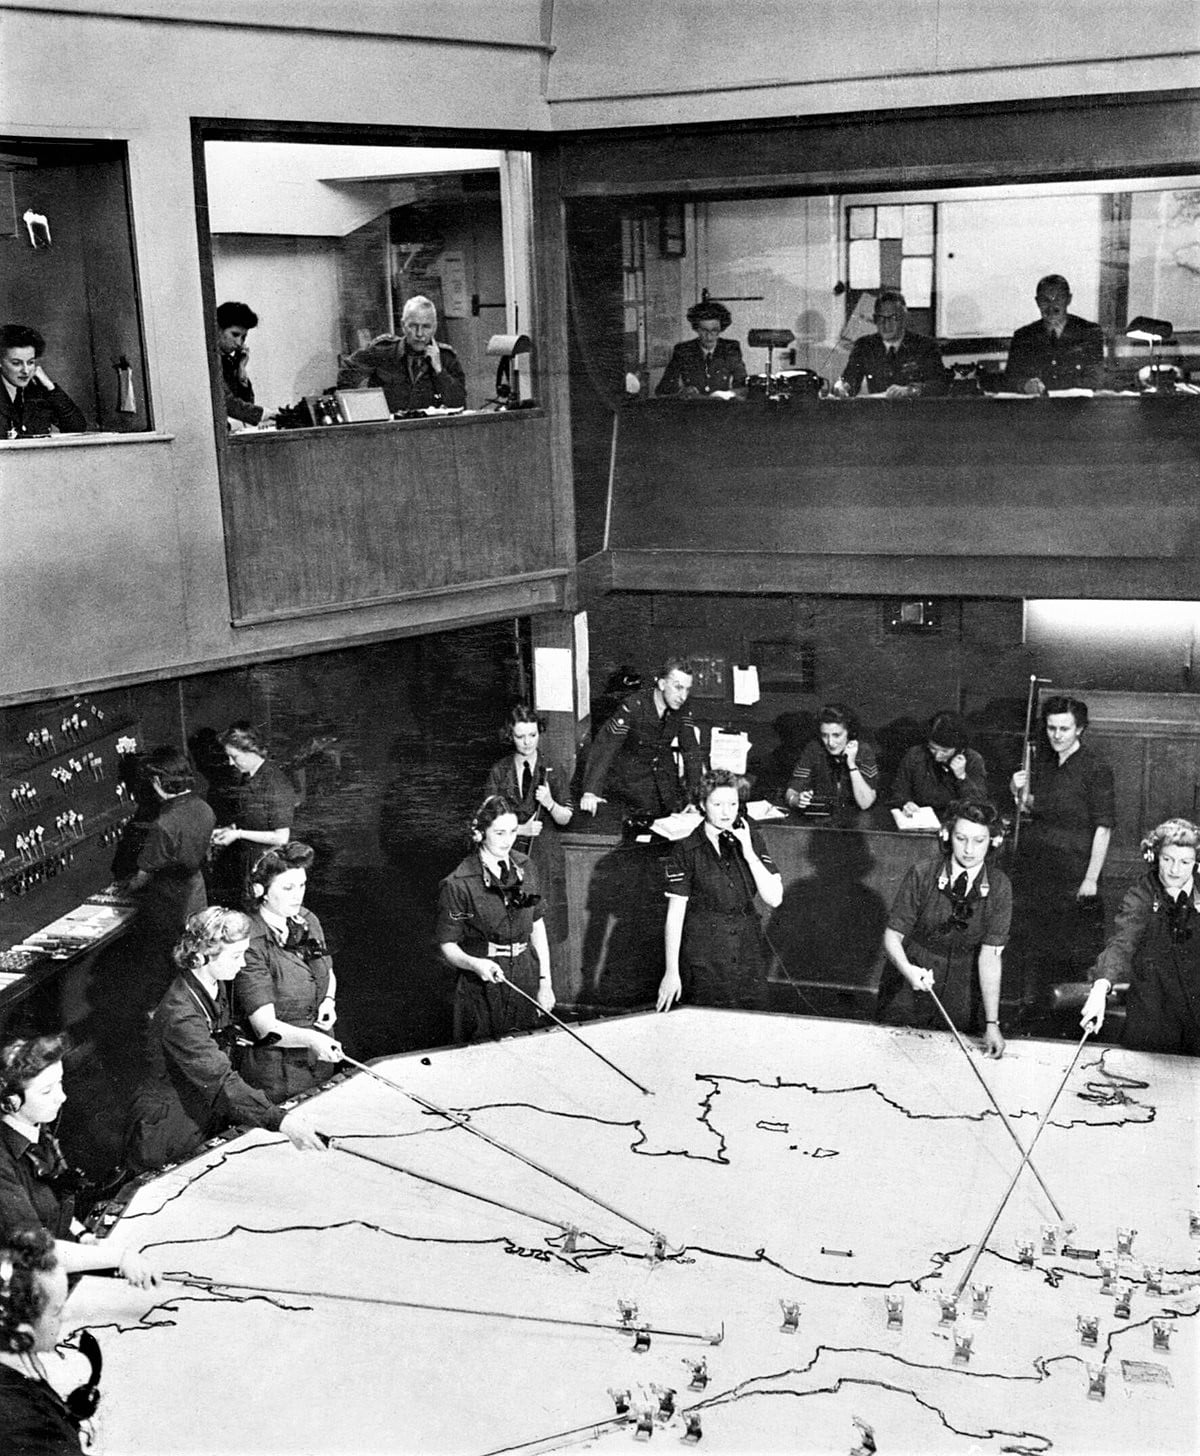
The dashboard has arguably become prolific in data science. Indeed we have heard from many of our own students that once their employer learns that they can create dashboards, this often becomes part of their job or helps them land a job. While dashboards are a great tool for ingesting information, they are not without their faults.
This article by Shannon Mattern provides an excellent history on the use of dashboards, dating all the way back to early 1900s.
Note
If you have the time, this entire article is quite interesting. However, if you are a bit short on time this week, we would strongly encourage you read the final section—“Critical Mud: Structuring and Sanitizing the Dashboard.”
Additional Resources
Learn-moreLearn More
- Quarto Dashboard Gallery - Example dashboards from the community of Quarto users
- Quarto Dashboard Tutorial - Simple starting guide
- Quarto Dashboard Reference - Reference to all functions / aspects of a Quarto dashboards