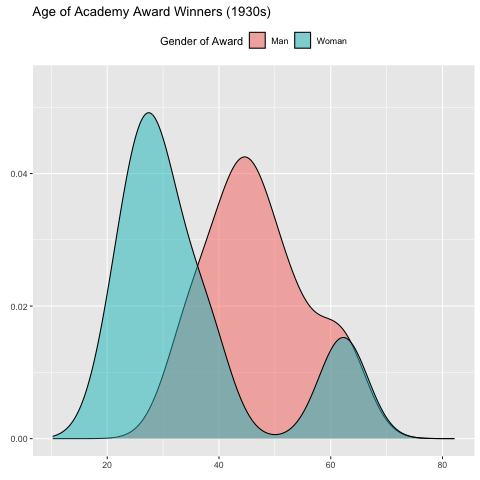
___ <- oscars %>%
  filter(Award_Gender != "Ungendered") %>%
  ggplot(aes(x = Age_at_Award, fill = Award_Gender)) +
  geom_density(alpha = 0.5) +
  labs(title = "Age of Academy Award Winners ({____}s)",
       x = "",
       y = "",
       fill = "Gender of Award") +
  theme(legend.position = "top") +
  ____(Decade_of_Award)

animate(p2, nframes = ____, fps = ____)
ggplot Extensions
gganimate
There are many, many ways to “spice up” your plots. We will focus in on one: making your plot animated! The best package for this, if you are using ggplot already, is gganimate.
Note
gganimate plot objects can sometimes take a long time to render. One way to make it quicker is to change the number of frames in your gif. Another trick is to use the cache chunk option in Quarto, so that you don’t re-render the images every time you knit your file.
Required-readingRequired Reading
Learn-moreLearn More
How to Create Plots with Beautiful Animation (Datanovia Blog Post)
Or you could watch Thomas Lin Pedersen’s Posit Conf 2019 talk on gganimate:
Check-inCheck In
- Fill in the five (5) blanks for the
gganimateplot below:
Other Extensions
Although we don’t have time to go in-depth on every single extension of ggplot, there are so many wonderful ways to up your Data Viz game.
Take a look around the links below!
Required-readingRequired Reading
Check-inCheck In
- Which extension package would you use to…
Hint: There is more than one possible answer for each question!
- Visualize a social network using twitter data?
- Add p-values to your side-by-side boxplot of treatment groups, showing the significance of the differences?
- Arrange several different plots next to each other?
- Make it so hovering over a point in your scatterplot shows the corresponding label?
Learn-moreLearn More
- The “dataisbeautiful” subreddit shares many nice visualizations.
- Don’t forget about the Data-to-Viz Website