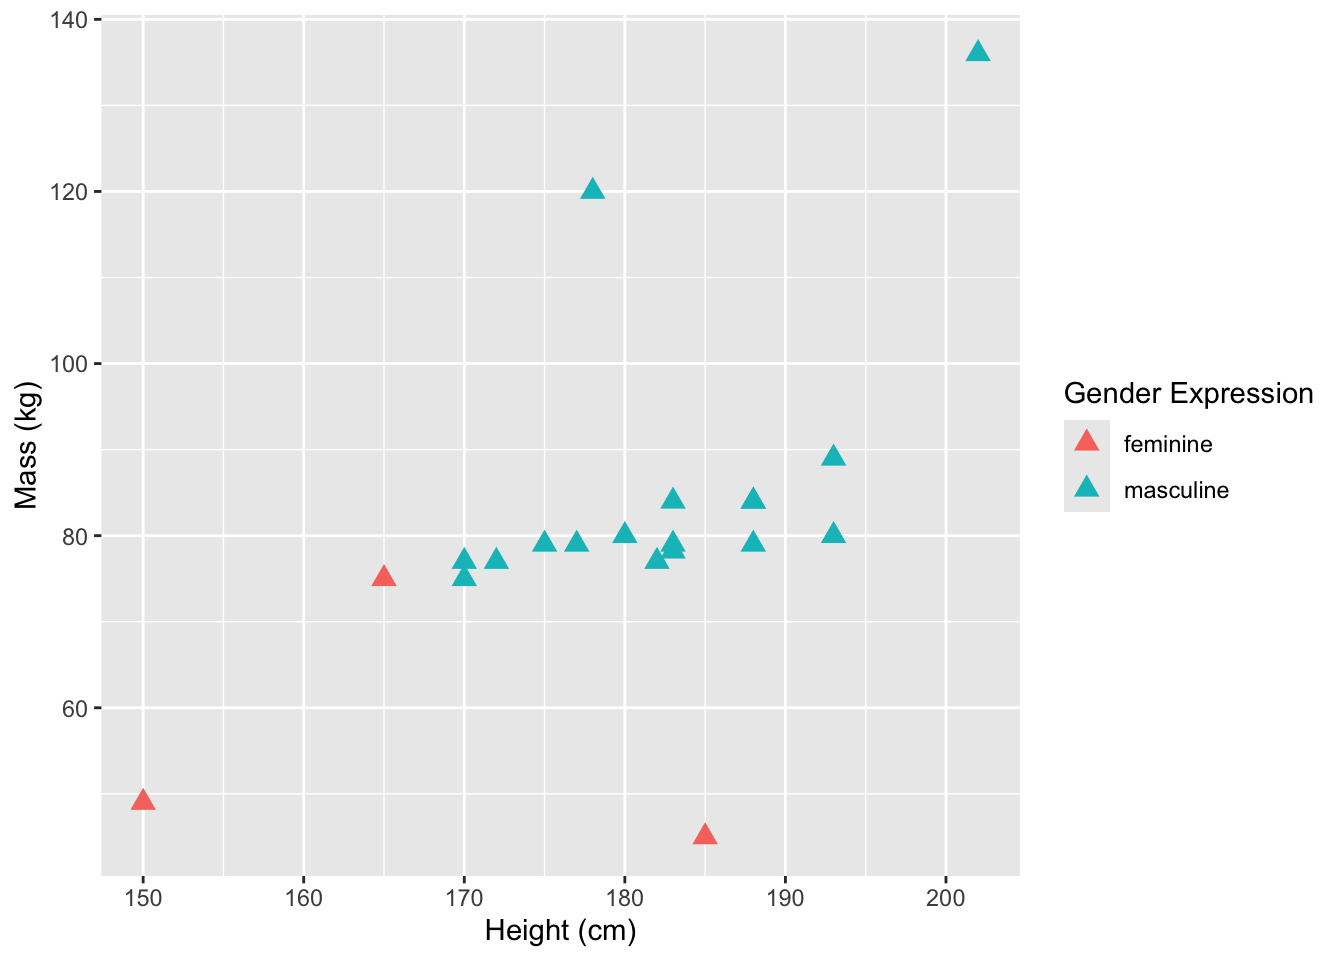
starwars %>%
  ____(species == "Human") %>%
  ggplot(mapping = aes(____ = height, y = mass, ____ = gender)) +
  geom_[____](____ = 17, size = 3) +
  ____(x = "Height (cm)",
       y = "Mass (kg)",
       color = "Gender Expression"
       )
ggplot Review
CautionOptional Content
This module consists of readings reviewing material typically taught in STAT 331. It is possible you can skip over portions of this reading. It is your responsibility to decide which areas you need to review before diving into Stat 541.
Answer the following questions to see if you can safely skip this section.
- Identify the elements of the following plot as
- An aesthetic
- A geometry
- A scale
- None of the above
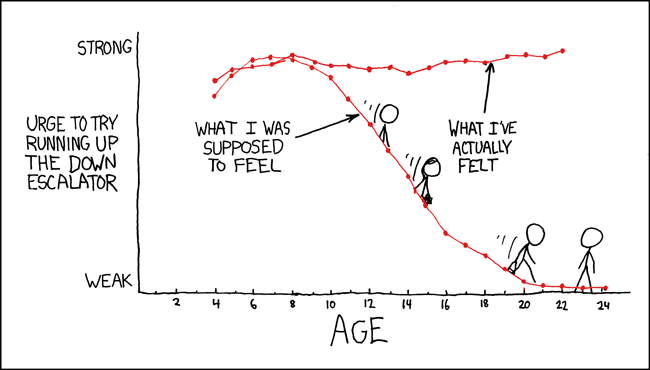
- The x-axis is age
- The y-axis is “Urge to run up the down escalator”
- The y-axis ranges from “Weak” to “Strong”
- This is a line graph
- The two lines are “What I was supposed to feel” and “What I’ve actually felt”
- The lines are labeled with text
- Only even ages are labelled
- Stick figure people are sliding down the line
- Fill in the six (6) blanks to make the plot below:
The Grammar of Graphics
If you had a hard time answering Question 1, I would recommend reviewing this content. You should feel comfortable with:
Knowing what goes into an aesthetic (
aes()) versus the geometry (geom_*())Identifying these elements of existing plots
Required-readingRequired Reading
Required-videoRequired Video
Using ggplot2
If you had a hard time answering Question 2, I would recommend reviewing this content. You should be comfortable with:
- Using the “big 5” geometries
geom_point()-
geom_bar()/geom_col() geom_line()geom_histogram()geom_boxplot()
- Changing optional arguments
- Shape of points
- Size of points
- Linewidth of line
- Binwidth of histogram
- Faceting
-
facet_wrap()for one categorical variable -
facet_grid()for two categorical variables
-
Required-readingRequired Reading