Midterm Project Guidelines
Your Task
For this project, you are expected to use a multiple linear regression to investigate the relationship between the variables you outlined in your Midterm Project Proposal.
Introduction
- In no fewer than six (6) sentences describe how the data were collected, the context of the data. Your description should address the following questions:
- Are these data from a study or a publication?
- What question do these data address?
- Why were the data collected?
- How were the data collected?
You may need to look up the publication(s) the data are associated with to obtain information on how they were collected.
- State the question(s) of interest you will address with your statistical analysis. The more specific you define the question of interest here, the easier the rest of the analysis and report will be. The research questions should start with, “What is the relationship between…” and should be as specific as possible. Your Discussion section should directly address the question(s) you pose here.
Methods
This section should lay out the steps, decisions, and logic leading to the statistical model you will use to answer the research question of interest.
- Describe the response and explanatory variables, how they were measured and their associated units. For categorical variables, describe the levels of the categorical variable.
You may need to look up the publication(s) the data are associated with to obtain information on how each variable was measured by the researchers.
Produce data visualizations exploring the relationship(s) you are interested in investigating, contrasting the need for a second explanatory variable.
- For a multiple linear regression with one numerical variable and one categorical variable, you should produce two visualizations, (1) a scatterplot where each group has a regression line with its own slope (interaction model), and (2) a scatterplot where every group has parallel regression lines (parallel slopes model).
- Describe what you see in the visualizations, making direct references to the plots! Specifically, your description or each plot needs to address the following:
- form
- direction
- strength
- outliers
- Outline the appropriate statistical model you will use to answer the question(s) of interest that you stated previously. Be specific about why the method being used are appropriate for the investigation at hand making direct reference to the visualizations.
The statistical model you fit in the next section depends on what you see in your visualization. Click here for a flowchart of how you should select the statistical model that is best for your situation.
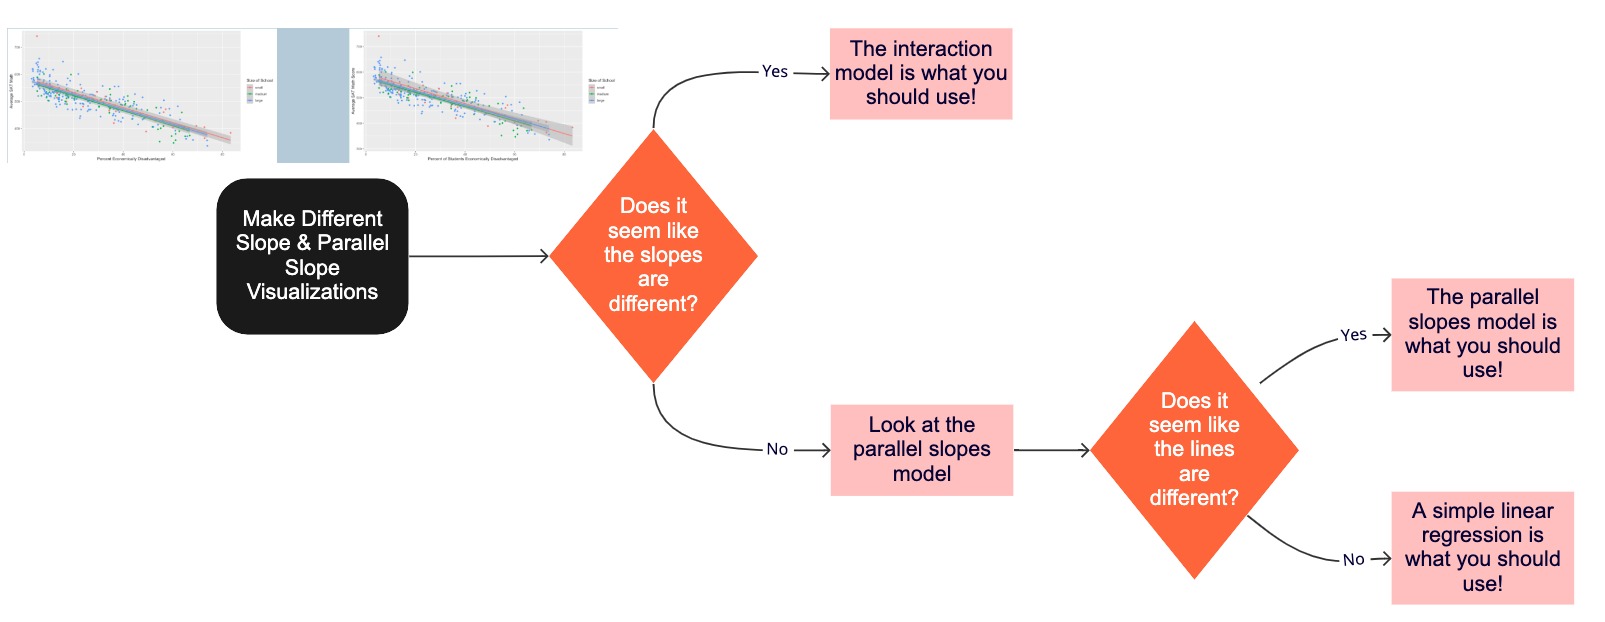
Results
In this section you will fit your statistical model and display the results.
- Fit the statistical model stated at the end of the Methods section
- Obtain the coefficients for the model
Use the get_regression_table() function from the moderndive package to provide nicely formatted output from your regression model.
Discussion
In this section you will write up your findings for each research question of interest.
Write out the estimated regression equation for your statistical model.
- For your regression equation, you can either use indicator variables (e.g. \(1_{CC}(x)\)) for each level of the categorical variable or write out a different equation for each group.
Interpret in the context of the data the coefficients from the regression equation.
You need to interpret both the intercept and the slope for each group!
Connect the findings of your regression back to the research question you posed in the Introduction.
Propose a possible explanation for why these results were observed.
You might need to do a bit of independent research on why you obtained the results you did.
Conclusions
In this section, you will provide a short summary of the key findings of your analysis, and their connection to the broader scientific community.
- Based on your visualizations and the regression model, what is your conclusion for the questions of interest?
There should be no mention of p-values in your conclusion!
What are the implications of this research for science in general?
Based on the sampling methods used, what larger population can you infer the results or your analysis onto?
Based on the design of the study, what type of statements can be made about the relationship between the explanatory and response variables. Specifically, can cause-and-effect statements be made?
Submission
You are expected to submit your rendered HTML file by the deadline. The entirety of the content for your project is expected to be included in your HTML file.
If you do not submit a first draft by the stated deadline, you will not receive feedback from Dr. Theobold. It is your responsibility to find a time to meet with Dr. Theobold to discuss your project before you submit your final draft.
If you do not submit a final version of your project by the stated deadline, your grade will be based on your first draft. If you did not submit a first draft, your grade on the project will be an F.
If you do not submit an HTML for the final version of your project because you were unable to render your project, you will receive a one letter grade deduction. Meaning, if you submit a Google Doc or a Word file with your project, you will receive a letter grade deduction in your project grade.