Lab 1 Solutions

R Code

You can differentiate the R code within a Quarto file from the body of the document, based on the gray boxes that start with an {r}.

Here is an example of an R code chunk:

Notice in the line after the {r} there are two lines that start with #| – this is the symbol that declares options for a code chunk. The #| label: allows us to specify a name for a code chunk, I typically choose a name that tells me what the code chunk does (e.g., load-packages, clean-data). The #| include: false option at the beginning of the code chunk controls how the code output looks in our final rendered document.

This code chunk has two things we want to pay attention to:

  1. The library(tidyverse) code loads in an R package called the “tidyverse”. This is code you will have in every lab assignment for this class!

  2. Code comments which are denoted by a # symbol. Code comments are a way for you (and me) to write what the code is doing, without R thinking what we are writing is code it should execute.

Running Code

In order for us to be able to use the contents of the tidyverse package (e.g., data, functions), we need to run the code chunk above! There are a few ways to do this:

  1. Clicking on the green “play” button in the upper right hand corner of the document. This will run all the code included in the code chunk.
  2. Putting your cursor in the code chunk and using a keyboard shortcut to run the code. On a PC the shortcut is Control + Enter (pressed at the same time). On a Mac the shortcut is Command + Return. This will run a single line of code, so you may need to do this multiple times is there is more than one line of code!

Question 4: Run the code in the above code chunk (load-packages) using either of these methods. What output do you see? What do you think this output is telling you?

Dr. T’s Solution

The code is telling you what packages are being loaded into the R session! When you load (library()) the tidyverse, it actually loads nine different packages. The lines at the bottom are warning you that when you loaded in the tidyverse, some of the functions had the same names as functions that already existed.

Rendering a HTML Document

When you click the Render button a document will be generated that includes both content as well as the output of any embedded R code chunks within the document. Rendering a document is similar to running the code within the document, as Quarto performs the same action (running each chunk of code) in order to render your final document.

Question 5: Click on the “Render” button to produce an HTML file (you may need to enable popups to see the rendered document). Do you see the above code chunk (load-packages) in the rendered HTML document? Why do you think this is the case?

Dr. T’s Solution

You don’t see the code or the output because the #| include: false option is telling Quarto not (false) to include the code or the output from that code chunk.

Including Code Output

You can include code output in your rendered document:

mpg
# A tibble: 234 × 11
   manufacturer model      displ  year   cyl trans drv     cty   hwy fl    class
   <chr>        <chr>      <dbl> <int> <int> <chr> <chr> <int> <int> <chr> <chr>
 1 audi         a4           1.8  1999     4 auto… f        18    29 p     comp…
 2 audi         a4           1.8  1999     4 manu… f        21    29 p     comp…
 3 audi         a4           2    2008     4 manu… f        20    31 p     comp…
 4 audi         a4           2    2008     4 auto… f        21    30 p     comp…
 5 audi         a4           2.8  1999     6 auto… f        16    26 p     comp…
 6 audi         a4           2.8  1999     6 manu… f        18    26 p     comp…
 7 audi         a4           3.1  2008     6 auto… f        18    27 p     comp…
 8 audi         a4 quattro   1.8  1999     4 manu… 4        18    26 p     comp…
 9 audi         a4 quattro   1.8  1999     4 auto… 4        16    25 p     comp…
10 audi         a4 quattro   2    2008     4 manu… 4        20    28 p     comp…
# ℹ 224 more rows

Question 6: Run the code above to see a preview of the mpg dataset. What are the observations (cases) in these data?

glimpse(mpg)
Rows: 234
Columns: 11
$ manufacturer <chr> "audi", "audi", "audi", "audi", "audi", "audi", "audi", "…
$ model        <chr> "a4", "a4", "a4", "a4", "a4", "a4", "a4", "a4 quattro", "…
$ displ        <dbl> 1.8, 1.8, 2.0, 2.0, 2.8, 2.8, 3.1, 1.8, 1.8, 2.0, 2.0, 2.…
$ year         <int> 1999, 1999, 2008, 2008, 1999, 1999, 2008, 1999, 1999, 200…
$ cyl          <int> 4, 4, 4, 4, 6, 6, 6, 4, 4, 4, 4, 6, 6, 6, 6, 6, 6, 8, 8, …
$ trans        <chr> "auto(l5)", "manual(m5)", "manual(m6)", "auto(av)", "auto…
$ drv          <chr> "f", "f", "f", "f", "f", "f", "f", "4", "4", "4", "4", "4…
$ cty          <int> 18, 21, 20, 21, 16, 18, 18, 18, 16, 20, 19, 15, 17, 17, 1…
$ hwy          <int> 29, 29, 31, 30, 26, 26, 27, 26, 25, 28, 27, 25, 25, 25, 2…
$ fl           <chr> "p", "p", "p", "p", "p", "p", "p", "p", "p", "p", "p", "p…
$ class        <chr> "compact", "compact", "compact", "compact", "compact", "c…
What uniquely separates each row from the other rows?

We can also preview a dataset using the glimpse() function.

Question 7: Run the code above and compare the output to the previous code (mpg). How is the output different? Which output do you prefer?

Dr. T’s Solution

The glimpse() output shows you roughly the same information as just typing mpg, but the appearance is very different. First, the columns are included as rows. Second, the dimensions of the data (rows and columns) are given at the top of the summary.

Personally, I like glimpse() but I could see why people would think the output is a bit strange.

Including Plots

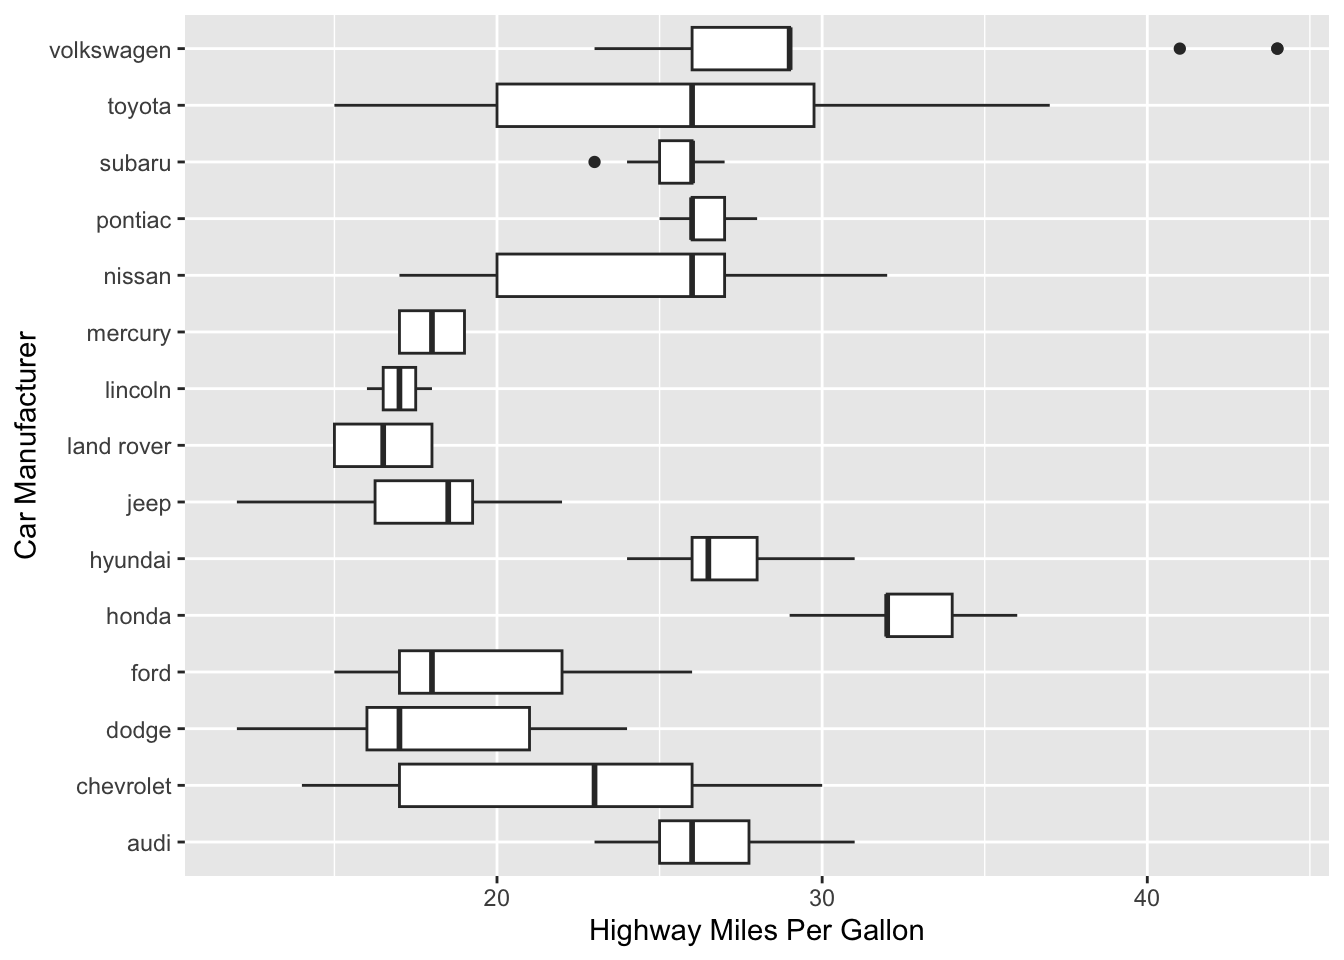
You can also embed plots in the rendered document. Here is an example of a plot:

Question 8: What do you think the echo: false option does in the above code chunk? Hint: Render the document and see what you see!

Dr. T’s Solution

The echo: false option tells Quarto that the R code should not be shown (but the plot should be!).

Question 9: What do you think the mapping = aes(y = manufacturer, x = hwy)) code does?

Dr. T’s Solution

As you learned this week, this is how we put variables on different aspects of the plot!

Question 10: What do you think the labs(x = "Highway Miles Per Gallon", y = "Car Manufacturer") code does?

Dr. T’s Solution

This is telling R what the labels on the plot should be!