Lab 2
Advanced Data Visualization
Instructions
Create a Quarto file for ALL Lab 2 (no separate files for Parts 1 and 2).
- Make sure your final file is carefully formatted, so that each analysis is clear and concise.
- Be sure your knitted
.htmlfile shows all your source code, including any function definitions.
Part One: Identifying Bad Visualizations
If you happen to be bored and looking for a sensible chuckle, you should check out these Bad Visualisations. Looking through these is also a good exercise in cataloging what makes a visualization good or bad.
Dissecting a Bad Visualization
Below is an example of a less-than-ideal visualization from the collection linked above. It comes to us from data provided for the Wellcome Global Monitor 2018 report by the Gallup World Poll:
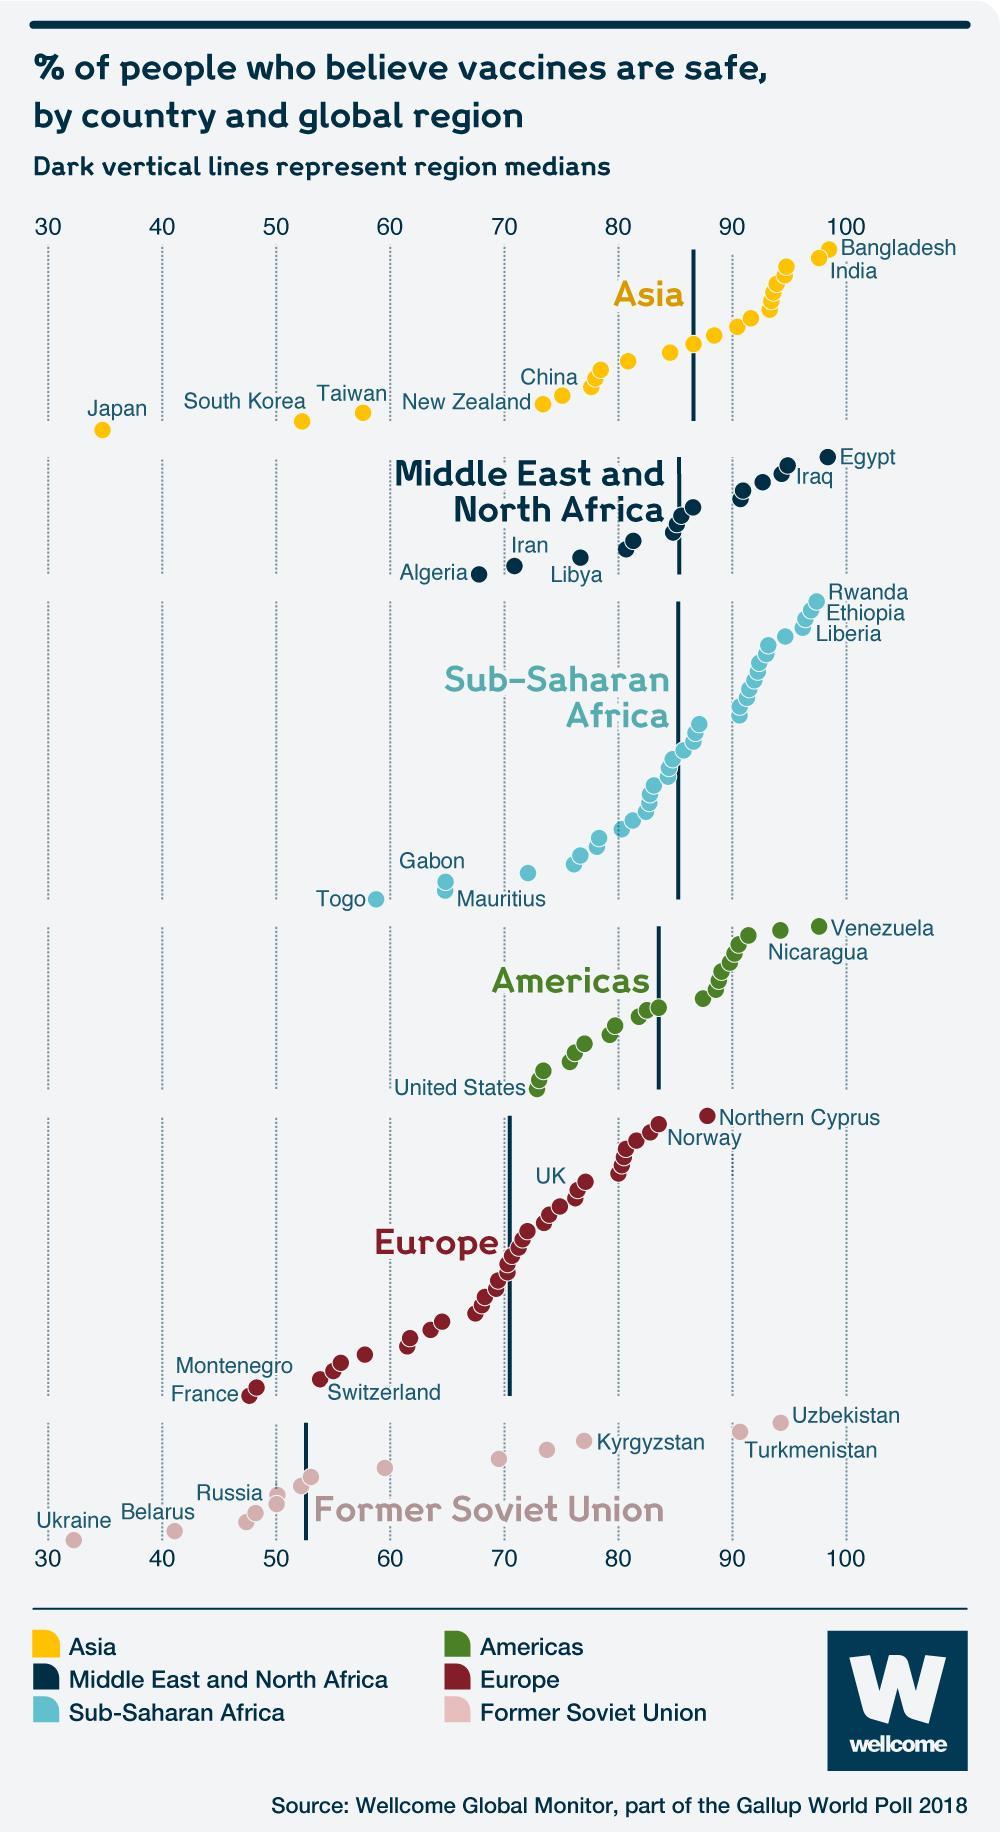
While there are certainly issues with this image, do your best to tell the story of this graph in words. That is, what is this graph telling you? What do you think the authors meant to convey with it?
List the variables that appear to be displayed in this visualization. Hint: Variables refer to columns in the data.
Now that you’re versed in the grammar of graphics (e.g.,
ggplot), list the aesthetics used and which variables are mapped to each.What type of graph would you call this? Meaning, what
geomwould you use to produce this plot?Provide at least four problems or changes that would improve this graph. Please format your changes as bullet points!
Improving the Bad Visualization
The data for the Wellcome Global Monitor 2018 report can be downloaded at the following site: https://wellcome.ac.uk/reports/wellcome-global-monitor/2018
There are two worksheets in the downloaded dataset file. You may need to read them in separately, but you may also just use one if it suffices.
- Improve the visualization above by either re-creating it with the issues you identified fixed OR by creating a new visualization that you believe tells the same story better.
Part Two: Broad Visualization Improvement
The full Wellcome Global Monitor 2018 report can be found here: https://wellcome.ac.uk/sites/default/files/wellcome-global-monitor-2018.pdf. Surprisingly, the visualization above does not appear in the report despite the citation in the bottom corner of the image!
Second Data Visualization Improvement
For this second plot, you must select a plot that uses maps so you can demonstrate your proficiency with the leaflet package!
Select a data visualization in the report that you think could be improved. Be sure to cite both the page number and figure title. Do your best to tell the story of this graph in words. That is, what is this graph telling you? What do you think the authors meant to convey with it?
List the variables that appear to be displayed in this visualization.
Now that you’re versed in the grammar of graphics (ggplot), list the aesthetics used and which variables are specified for each.
What type of graph would you call this?
List all of the problems or things you would improve about this graph.
Improve the visualization above by either re-creating it with the issues you identified fixed OR by creating a new visualization that you believe tells the same story better.
Third Data Visualization Improvement
For this third plot, you must use one of the other ggplot2 extension packages mentioned this week (e.g., gganimate, plotly, patchwork, cowplot).
Select a data visualization in the report that you think could be improved. Be sure to cite both the page number and figure title. Do your best to tell the story of this graph in words. That is, what is this graph telling you? What do you think the authors meant to convey with it?
List the variables that appear to be displayed in this visualization.
Now that you’re versed in the grammar of graphics (ggplot), list the aesthetics used and which variables are specified for each.
What type of graph would you call this?
List all of the problems or things you would improve about this graph.
Improve the visualization above by either re-creating it with the issues you identified fixed OR by creating a new visualization that you believe tells the same story better.