In this exam, you will be asked to answer questions about pre-written code; to fill in small blanks in code; or to sketch the output of a process or analysis. Your fill-in-the-blank answers need to be conceptually correct, not perfect. For example, if you fill in a blank with mutates instead of mutate, you will still get full credit.
You may assume throughout the exam that there are no syntax errors in the code - for example, you will not be asked to spot a missing comma, an unclosed parentheses, or a typo in an object name. There are also no “trick” questions - the code you are shown can be expected to run without error, unless specifically stated in the question.
Part A - Complex Data Pipelines Sample Question
Consider the following two datasets:
A list of all Pixar films, with some information about them:
# A tibble: 6 × 5
  number title           release_date run_time film_rating
   <dbl> <chr>           <date>          <dbl> <chr>
1      1 Toy Story       1995-11-22         81 G
2      2 A Bug's Life    1998-11-25         95 G
3      3 Toy Story 2     1999-11-24         92 G
4      4 Monsters, Inc.  2001-11-02         92 G
5      5 Finding Nemo    2003-05-30        100 G
6      6 The Incredibles 2004-11-05        115 PG
Ratings from various film rating sources for Pixar movies:
# A tibble: 6 × 5
  film            rotten_tomatoes metacritic cinema_score critics_choice
  <chr>                     <dbl>      <dbl> <chr>                 <dbl>
1 Toy Story                   100         95 A                        NA
2 A Bug's Life                 92         77 A                        NA
3 Toy Story 2                 100         88 A+                      100
4 Monsters, Inc.               96         79 A+                       92
5 Finding Nemo                 99         90 A+                       97
6 The Incredibles              97         90 A+                       88
Question 1
First, we want to add the ratings data from the imdb dataset to the Pixar movie list.
Fill in the blank to make this work.
pixar_new<-pixar_films|>left_join(public_response, by =join_by(title==film))
Question 2
Notice that the original pixar dataset has the same number of rows as the new, joined dataset:
# A tibble: 4 × 5
  decade     A  `A+`  `A-`  `NA`
  <glue> <int> <int> <int> <int>
1 1990s      2     1    NA    NA
2 2000s      3     4    NA    NA
3 2010s      8     2     1    NA
4 2020s     NA    NA     1     5
Part B - Webscraping Sample Question
Wikipedia sites tend to contain consistent information across similar articles, usually in a box on the right. Entries about people typically include a picture of the person and their date of birth at the top. For example, here is Hadley Wickham’s Wikipedia page:
Consider the following function, designed to scrape the birthdate of a Wikipedia entry:
What would you change in the function to deal with these types of issues?
Question 5
How would you make use of this function to add a column named age to the following dataset, named r_people? Specifically, what functions would you use and how would you use them?
# A tibble: 6 × 2
  name             position
  <chr>            <chr>
1 Robert Gentleman R Creator
2 Ross Ihaka       R Creator
3 Hadley Wickham   Posit Employee
4 Jenny Bryan      Posit Employee
5 Allison Theobold Cal Poly Prof
6 Kelly Bodwin     Cal Poly Prof
Part C - More Advanced Visualizations Sample Question
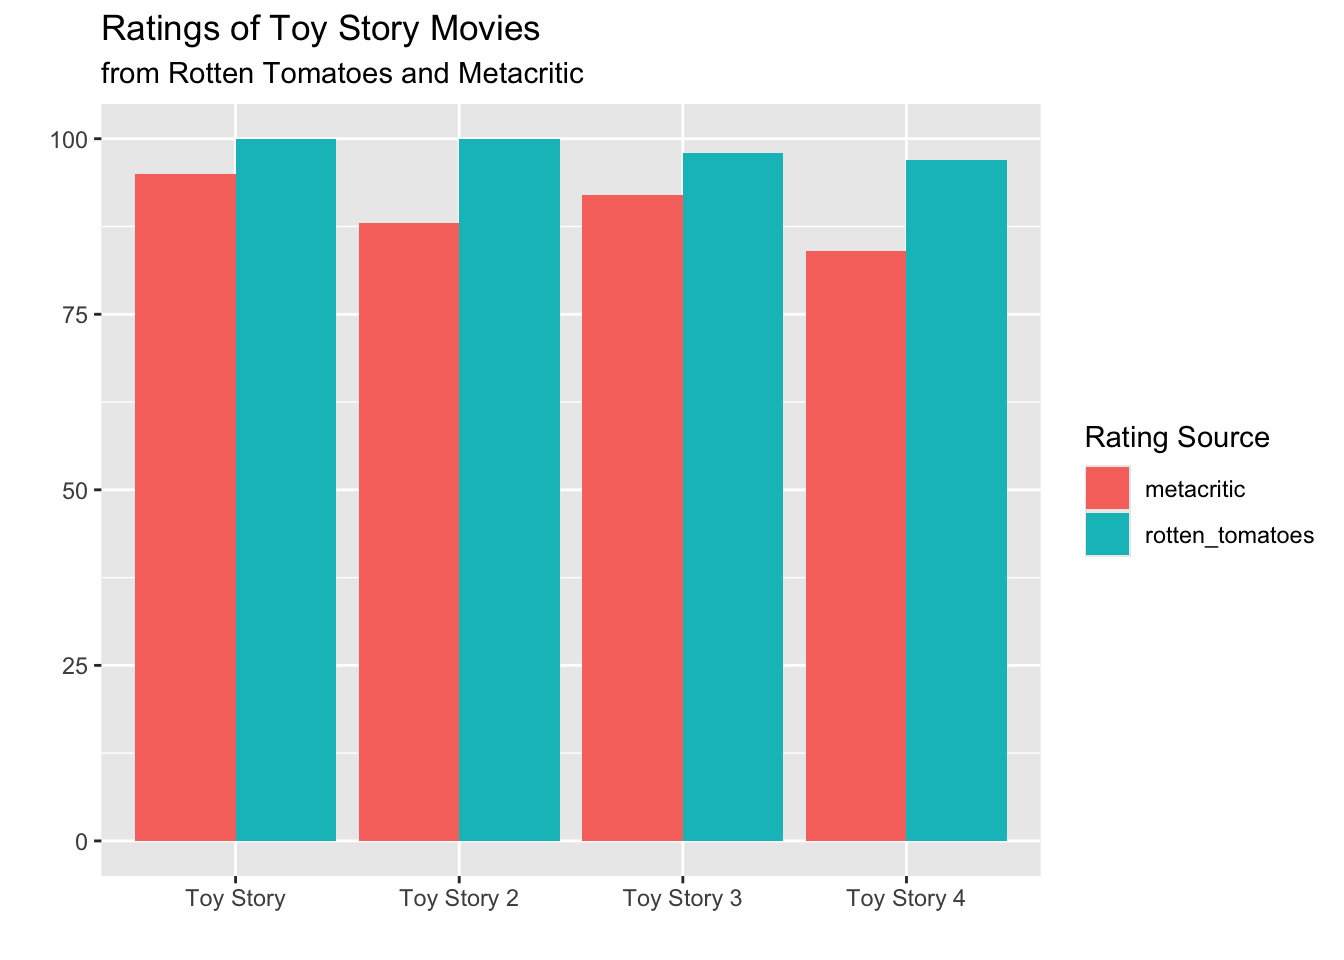
The following outputs show a summary table or visualization from the dataset pixar_new. For each, provide:
what (if any) data wrangling steps are needed to prepare the data for this visualization,
the aesthetic(s) of the visualization or the gt formatting used, and
one major improvement you would make to the analysis.
Note that a major improvement is something that changes the structure of the output, not just a different color, label, or stylistic choice. At least one of your (iii) answers must suggest a different geometry for the plot.
For these answers, you may respond in either words or code. For example, these two answers would both be acceptable:
mutate(z = x + y)
“Add a new column named z that is the sum of x and y.”