
trout %>%
  group_by(section) %>%
  summarize(
    mean_length = mean(length_1_mm,
                       na.rm = TRUE)
)Incorporating Categorical Variables
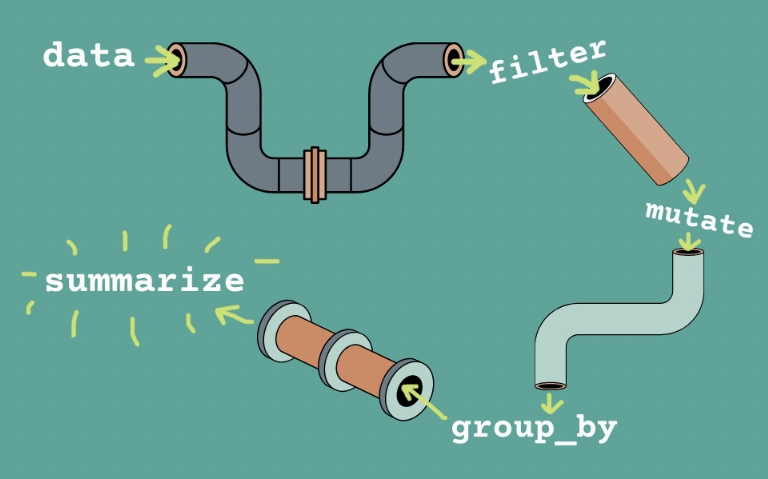
dplyr – a tool bag for data wrangling

filter()
select()
mutate()
summarize()
arrange()
group_by()
The Pipe ![A hex of the pipe operator from the magrittr package. The pipe operator is a % followed by a > followed by another %, which is used to chain data wrangling operations together.]()
Salamander Size
ggplot(data = salamander,
       mapping = aes(x = length_2_mm)) +
  geom_histogram(binwidth = 14, color = "white") +
  labs(x = "Snout to Tail Length of Salamander (mm)")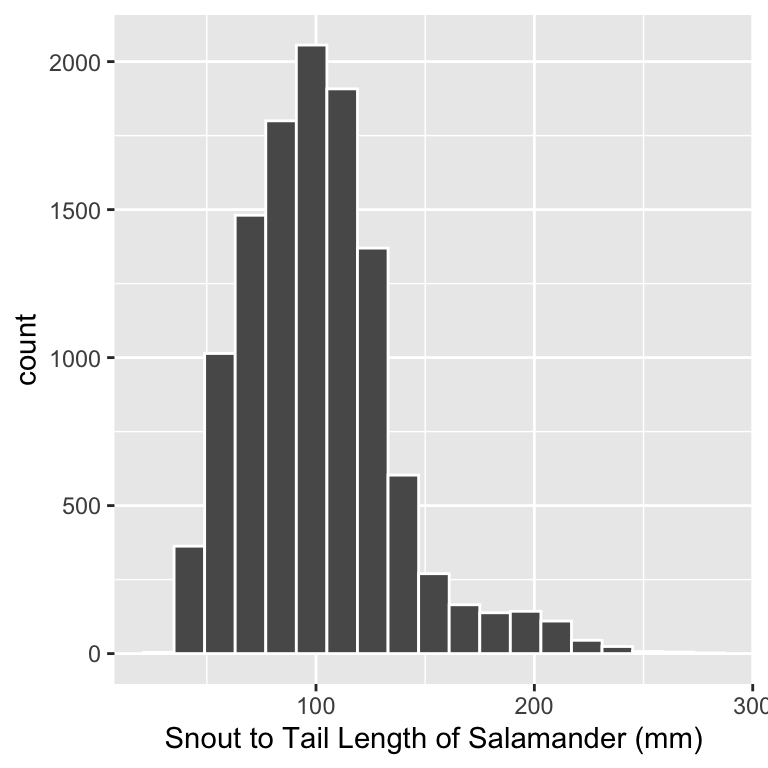
How would this histogram look if there was no variation in salamander length?
What are possible causes for the variation in salamander length?
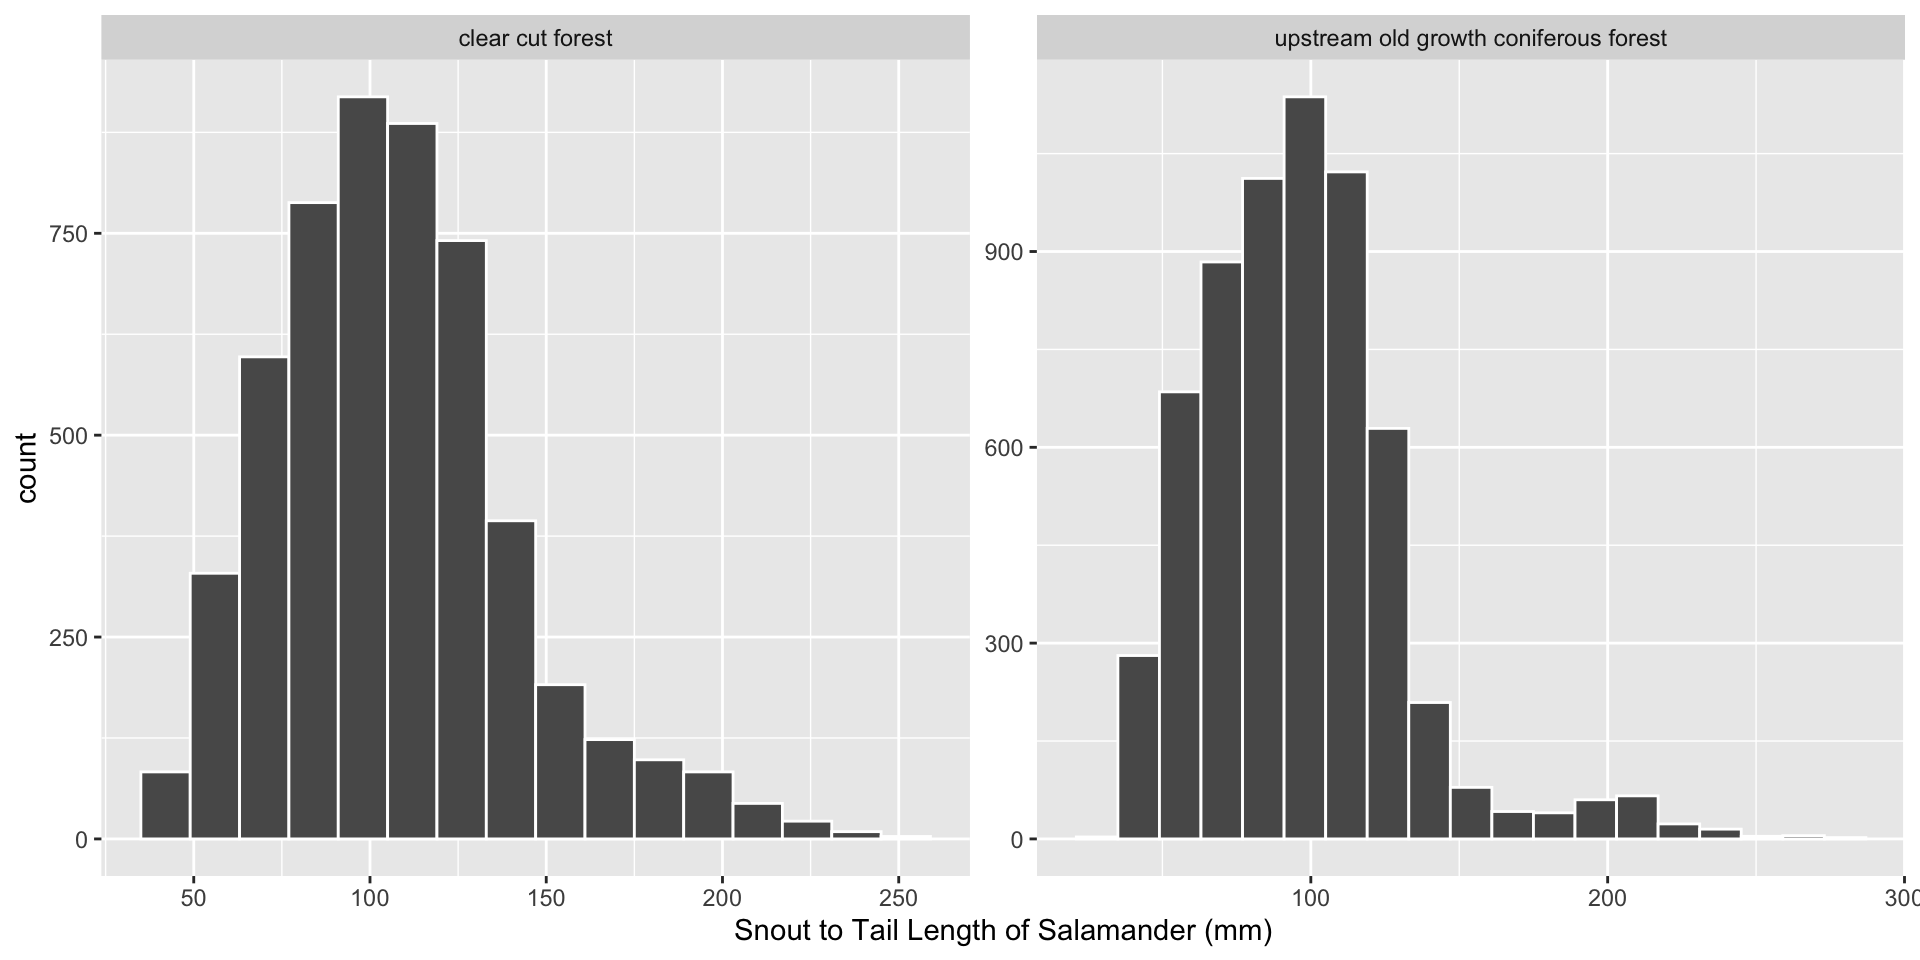
Faceted Histograms
Side-by-Side Boxplots
ggplot(data = salamander,
       mapping = aes(x = length_1_mm,
                     y = species)
         ) +
  geom_boxplot() +
  labs(x = "Snout to Tail Length (mm)",
y = "") 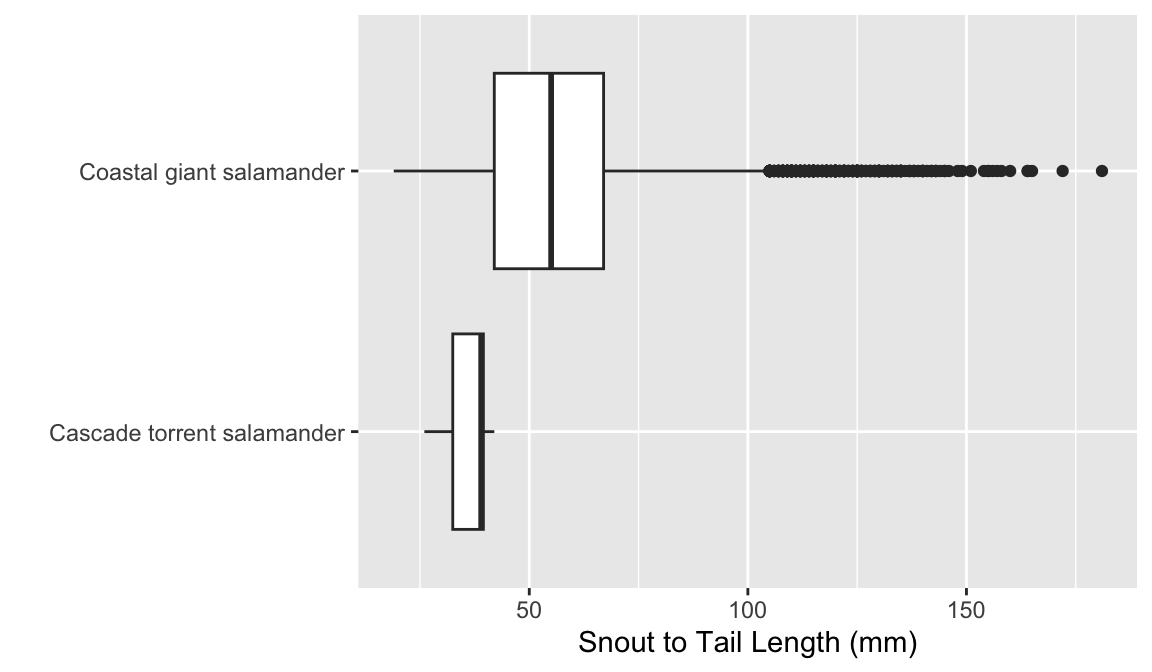
ggplot(data = salamander,
       mapping = aes(y = length_1_mm,
                     x = species)
         ) +
  geom_boxplot() +
  labs(y = "Snout to Tail Length (mm)",
       x = "")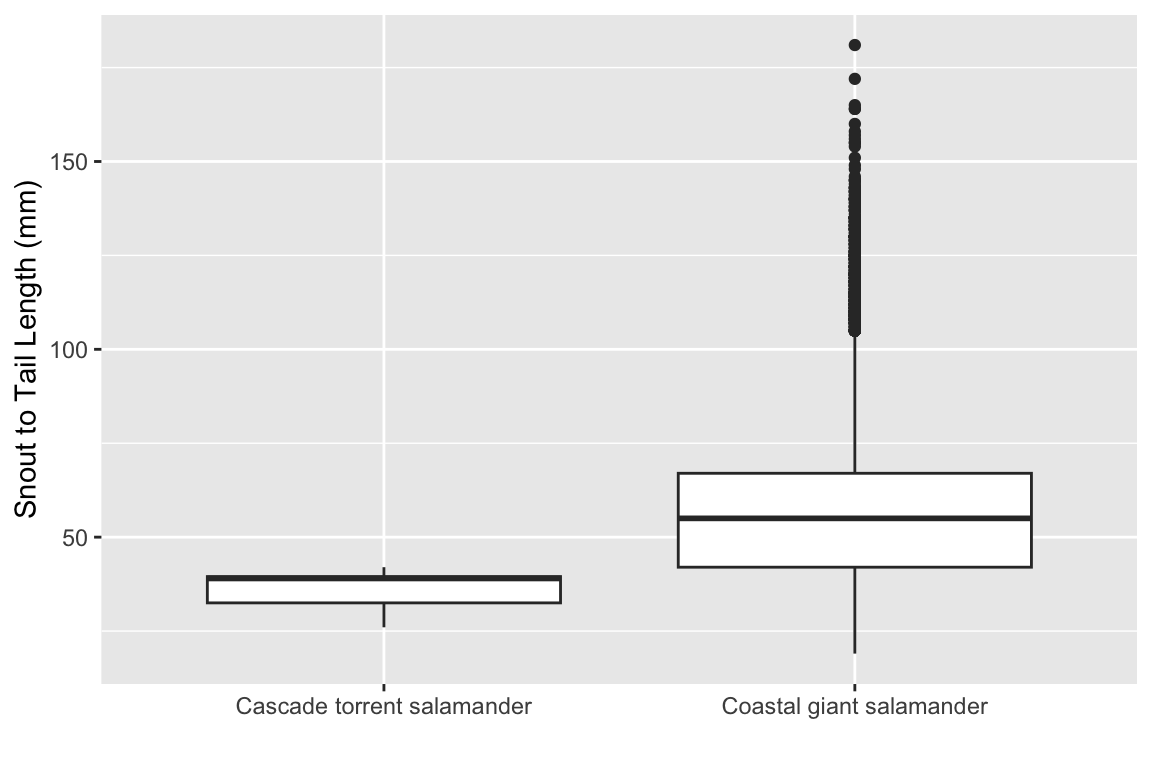
Colors in Boxplots
ggplot(data = salamander,
       mapping = aes(x = length_1_mm,
                       y = species,
                       color = unittype)
         ) +
  geom_boxplot() +
  labs(x = "Snout to Tail Length (mm)",
       y = "",
       color = "Channel Type")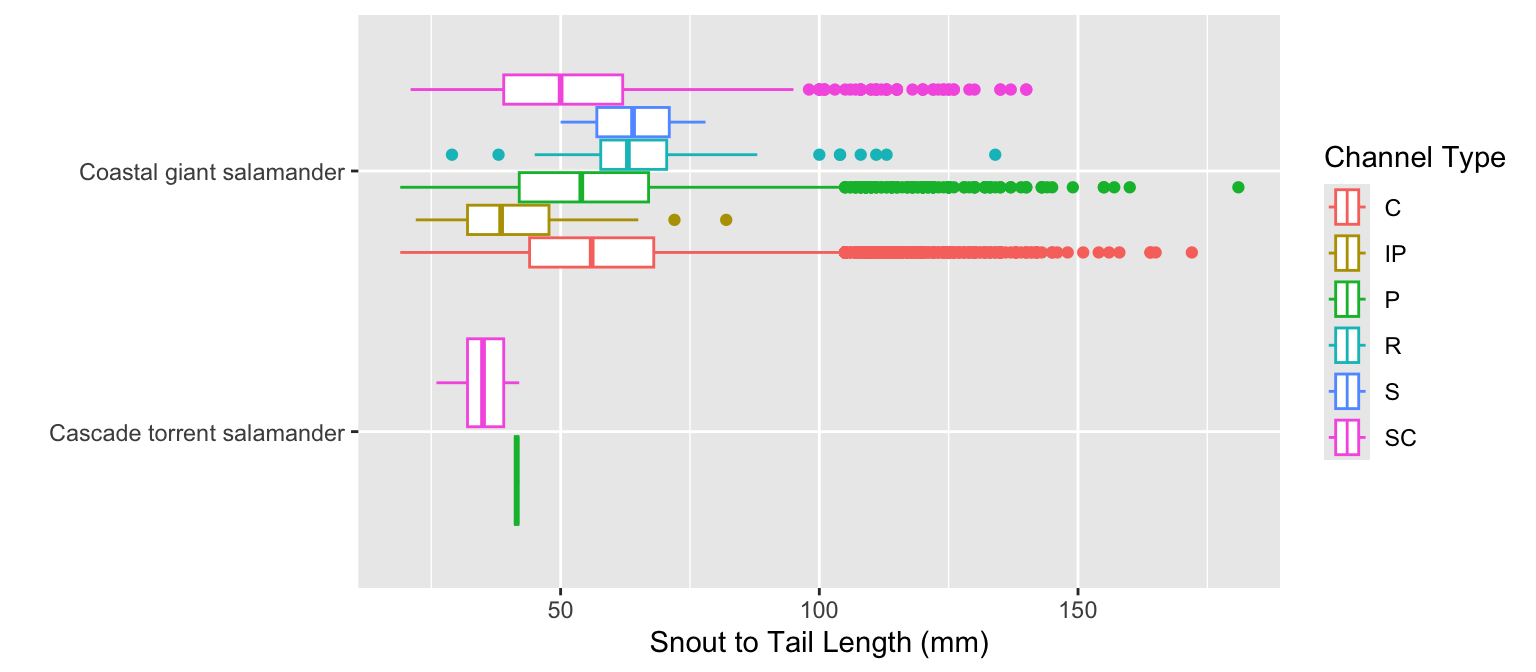
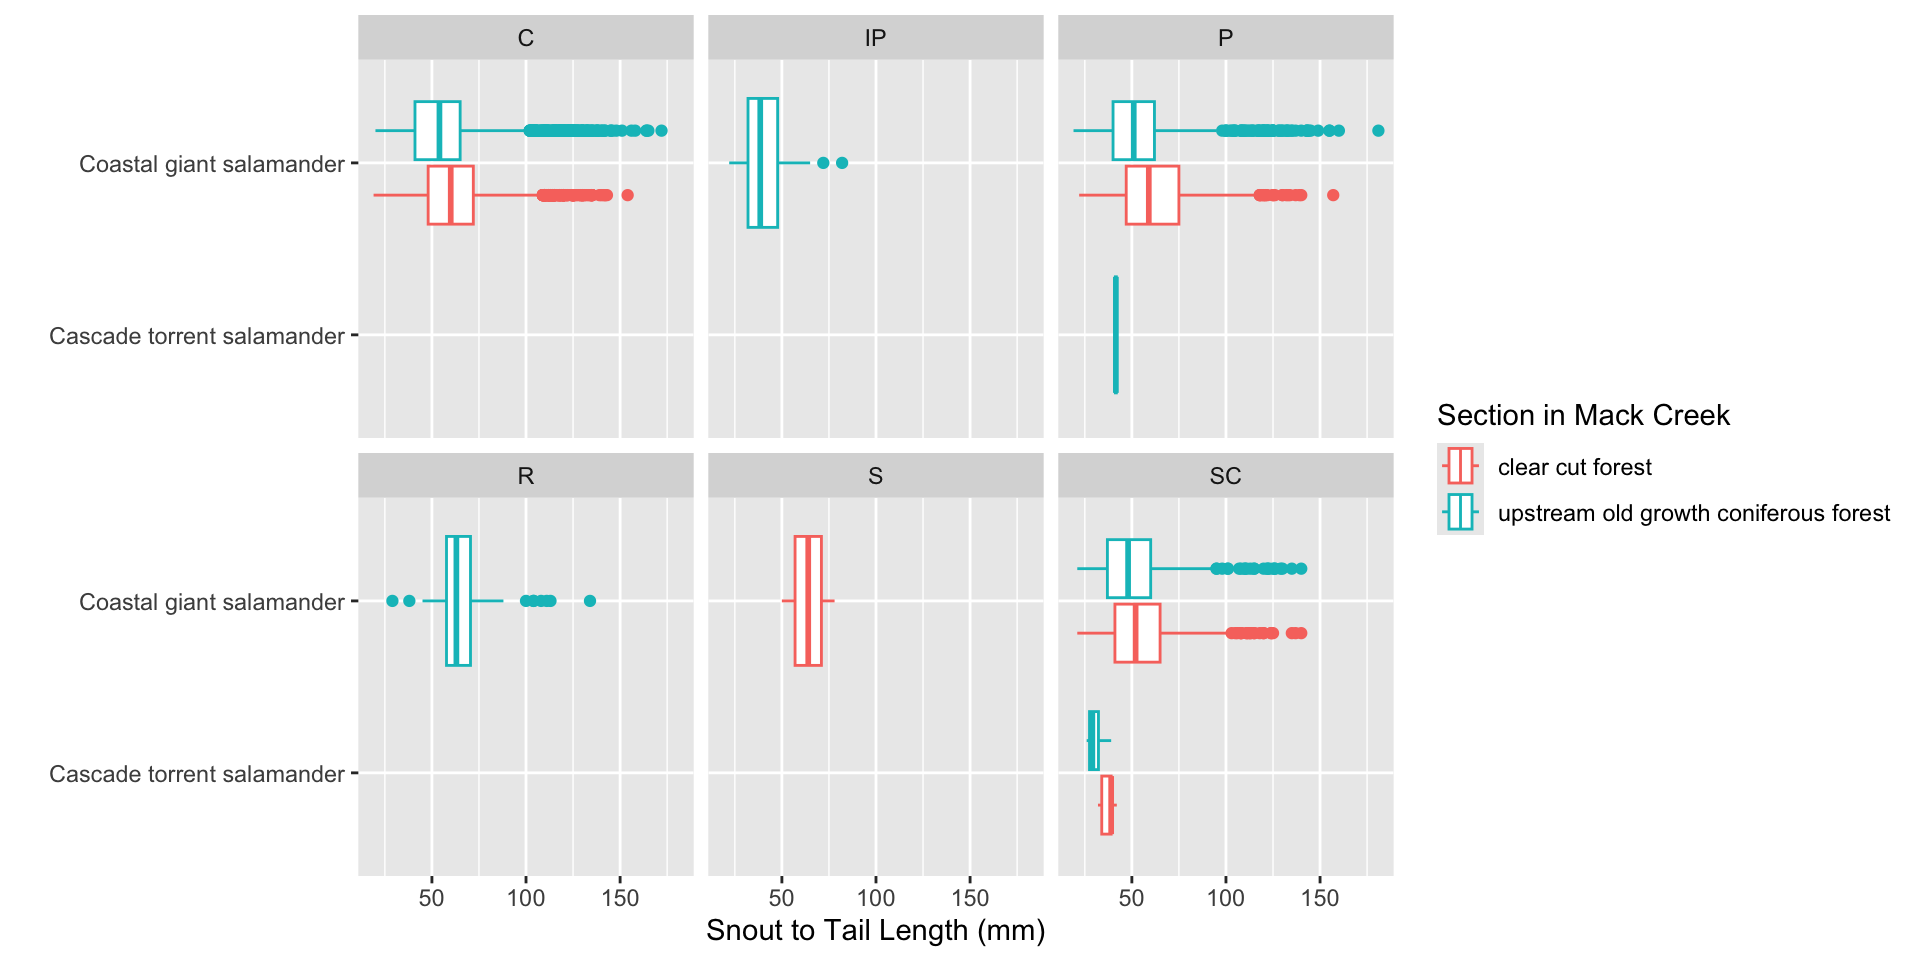
Facets & Colors in Boxplots
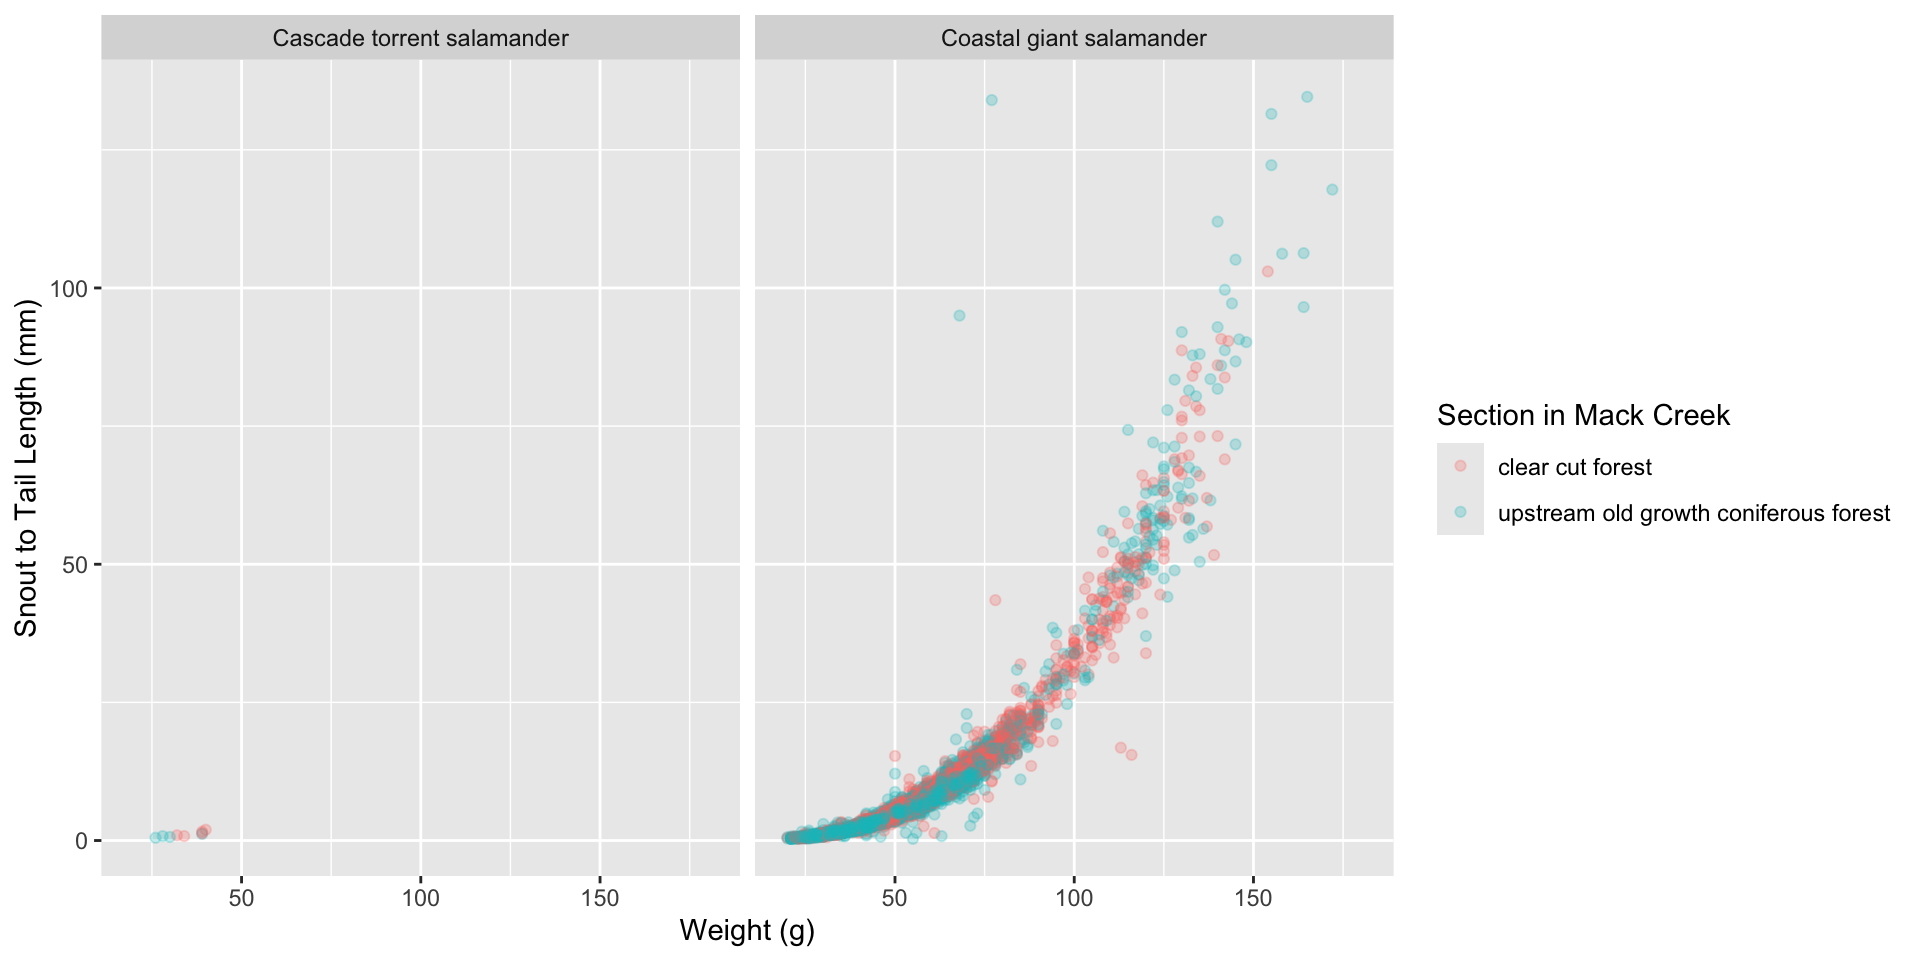
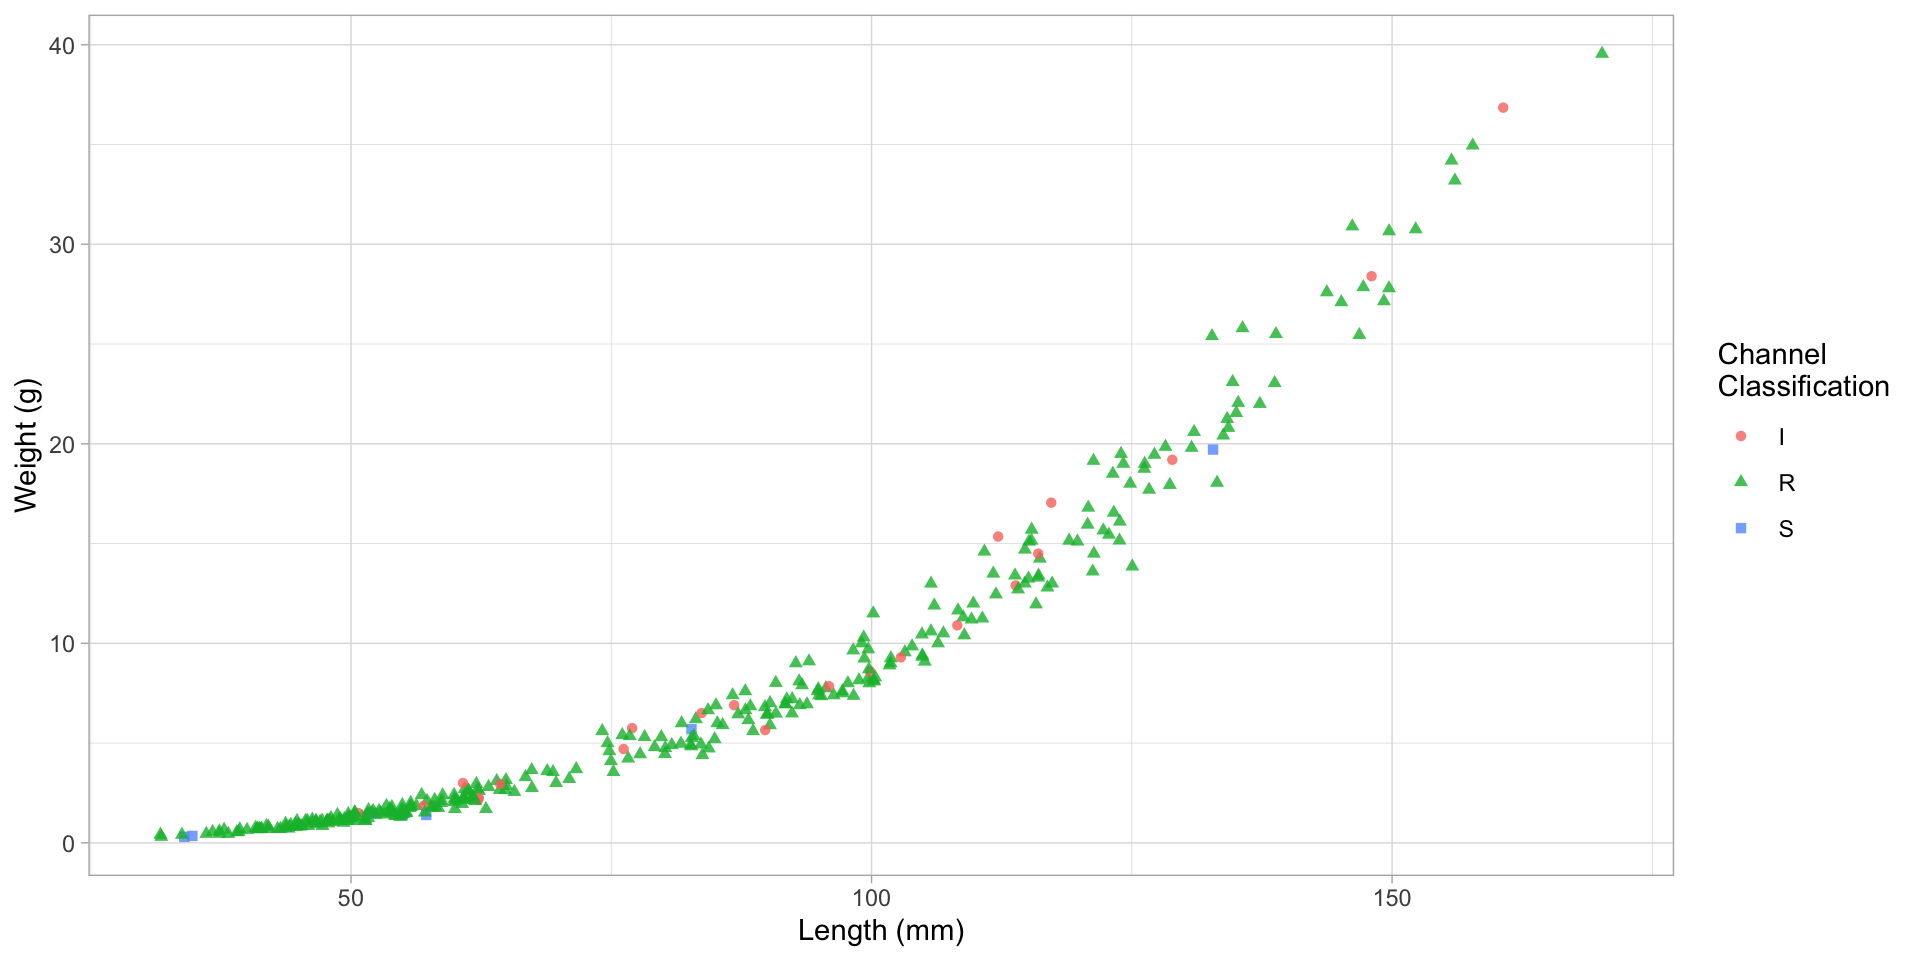
Facets & Color in Scatterplots
Your Turn – 90 seconds
What are the aesthetics included in this plot?
What is one aspect of this plot that you believe is well done? What is one aspect of the plot that could be improved?
Your Tasks
Read the Background and Methods in the summary at the beginning of the Tuan et al. paper. Then answer the following questions:
What data is involved in this research study?
What are the research questions / research goals?