ggplot & Importing data review

STAT 331

Data Visualizations with ggplot2
What are the aesthetics in this plot?

What geometric object is being plotted?

Univariate (One Variable) Visualizations – For Numerical Data

  • Histogram
  • Boxplot
  • Density Plot

Histogram

ggplot(data = penguins, mapping = aes(x = bill_length_mm)) + 
  geom_histogram() +
  labs(x = "Bill Length (mm)")

Pros

  • Easy to inspect
  • Higher bars represent where data are relatively more common
  • Inspect shape of a distribution (skewed or symmetric)
  • Identify modes

Cons

  • Do not plot raw data, plot summaries (counts) of the data!
  • Sensitive to binwidth

Boxplot

ggplot(data = penguins,
       mapping = aes(x = bill_length_mm)) +
  geom_boxplot() + 
  labs(x = "Bill Length (mm)")

  • What calculations are necessary to create a boxplot?

  • What are strengths of a boxplot?

  • What are weaknesses of a boxplot?

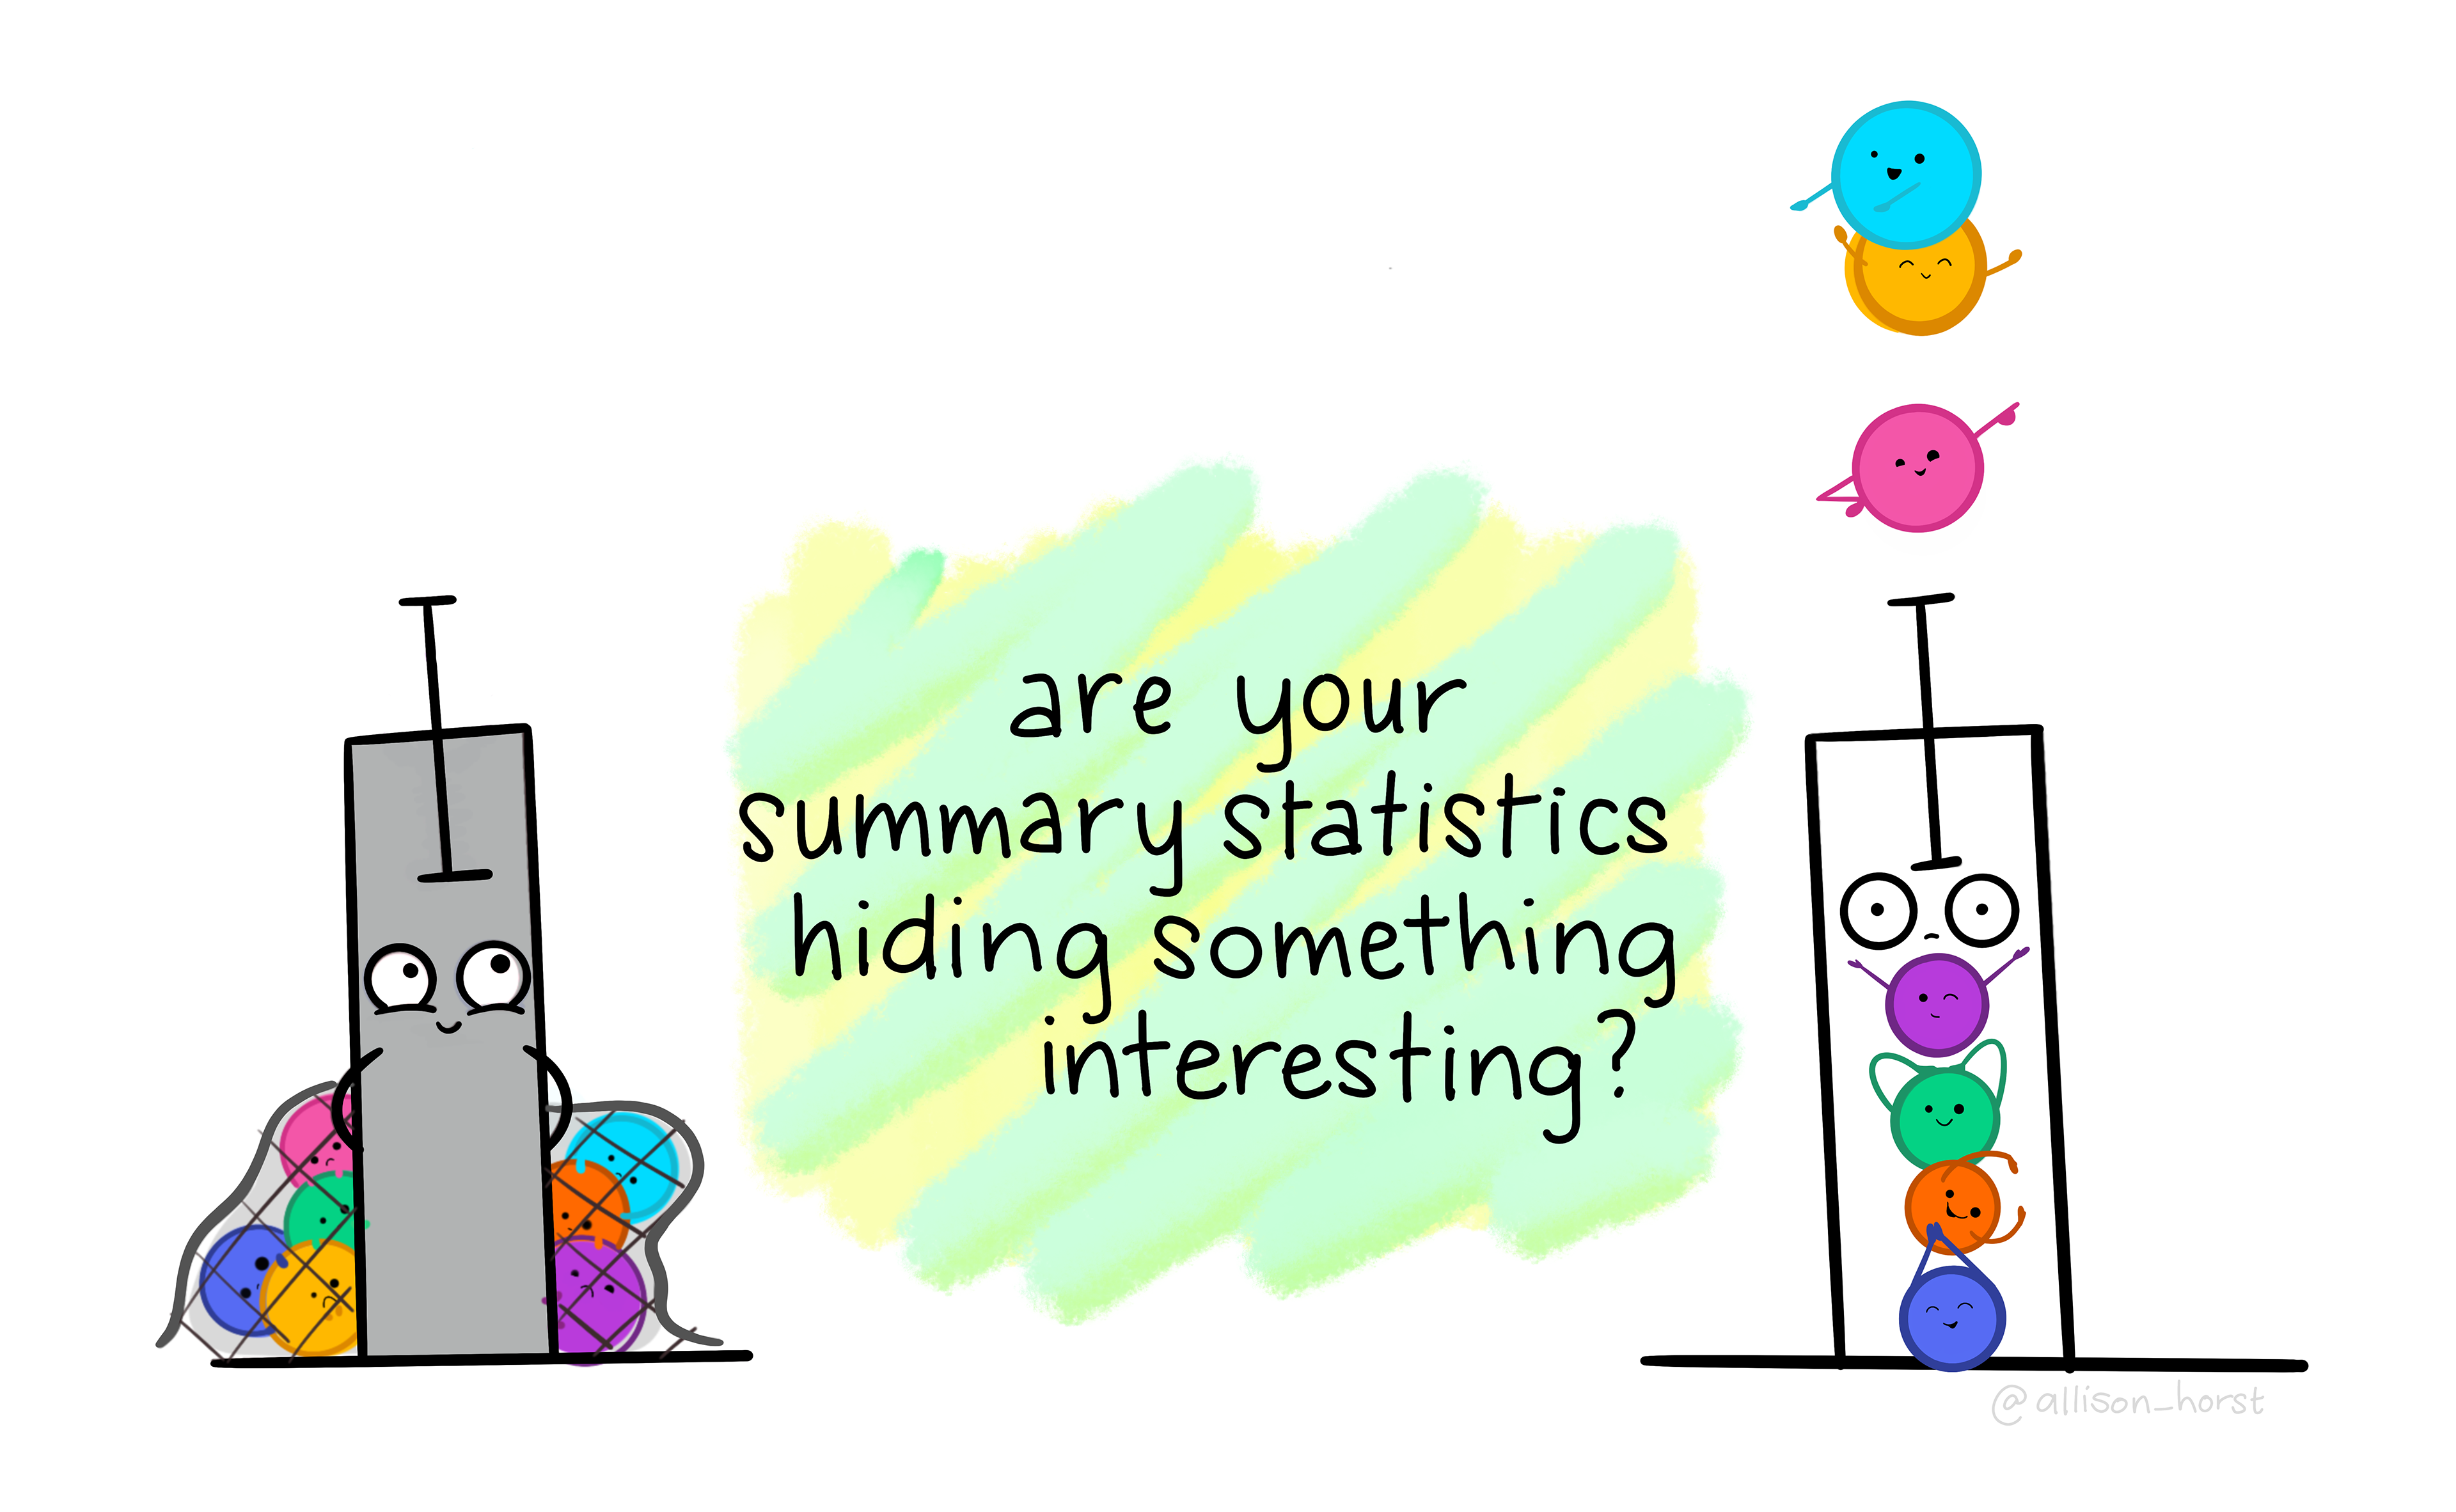
Image by Allison Horst

Density Plot

ggplot(data = penguins,
       mapping = aes(x = bill_length_mm)) +
  geom_density() + 
  labs(x = "Bill Length (mm)")

  • A smooth approximation to a variable’s distribution
  • Plots density (as a proportion) on the y-axis

Bivariate (Two Variables) Visualizations – For Numerical Data

  • Side-by-Side Boxplots

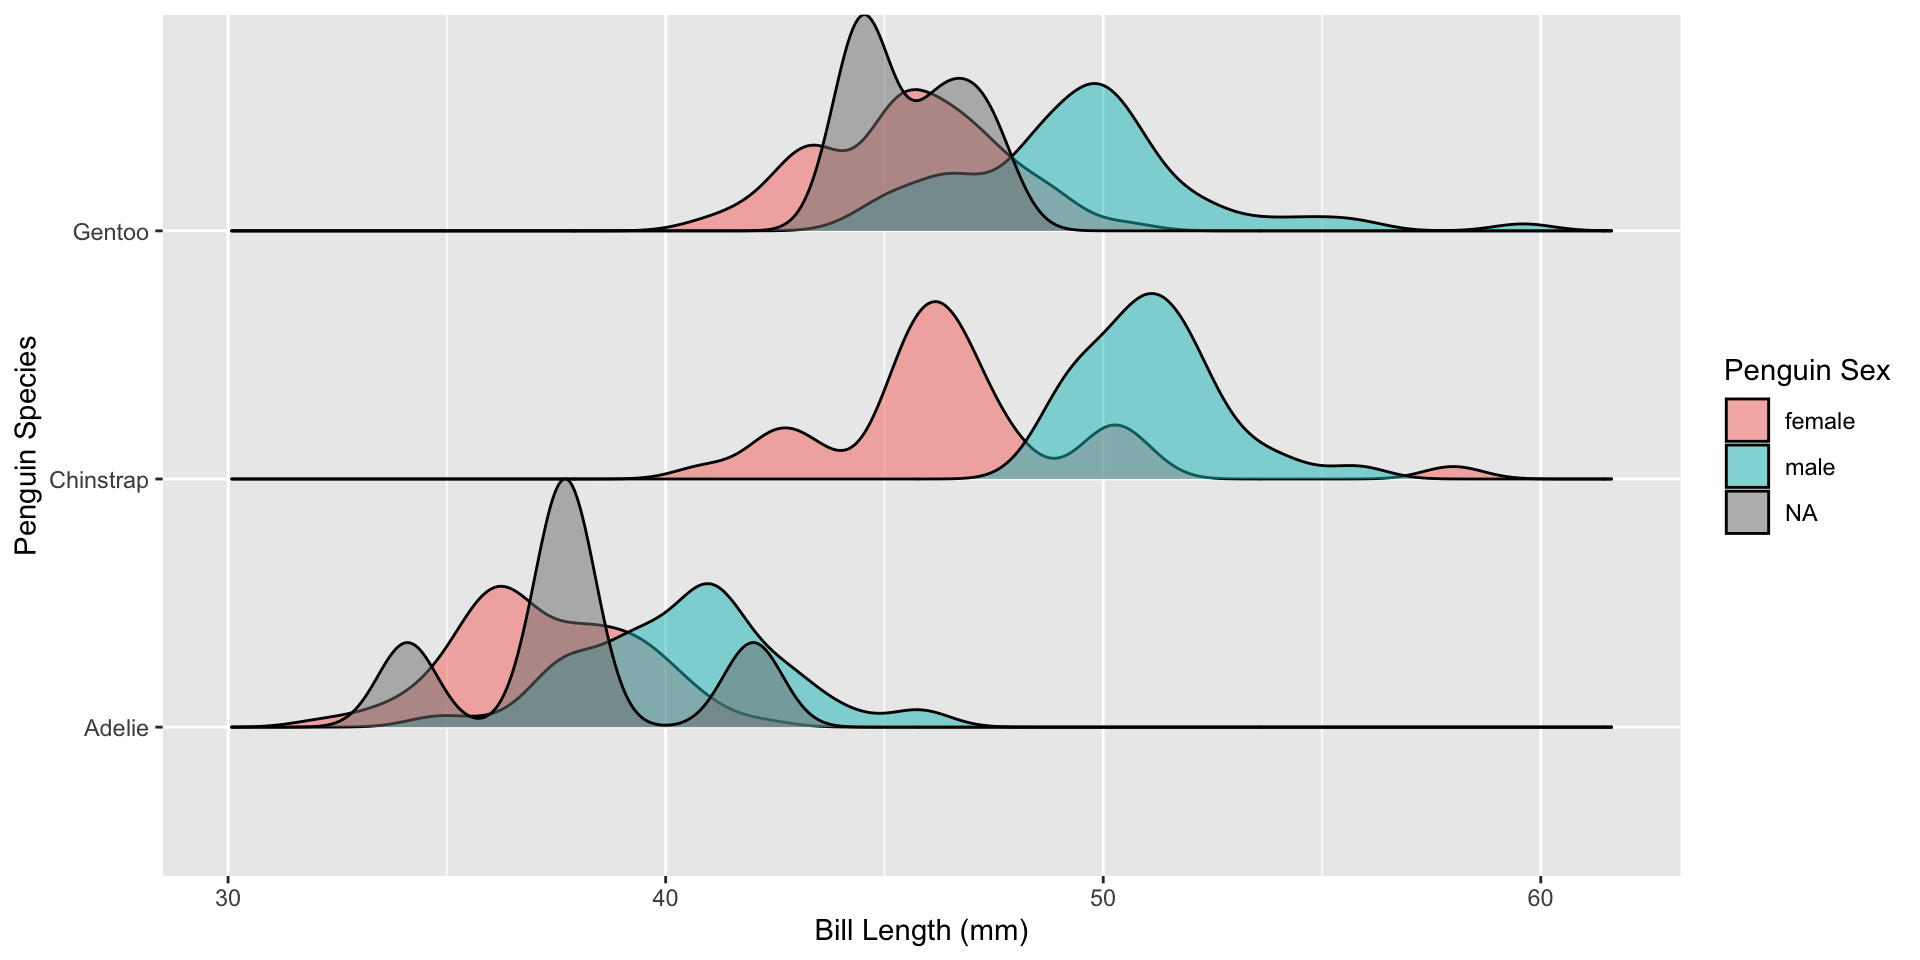
  • Side-by-Side Density Plots (Ridge Plots)

  • Scatterplots

  • Faceted Histograms

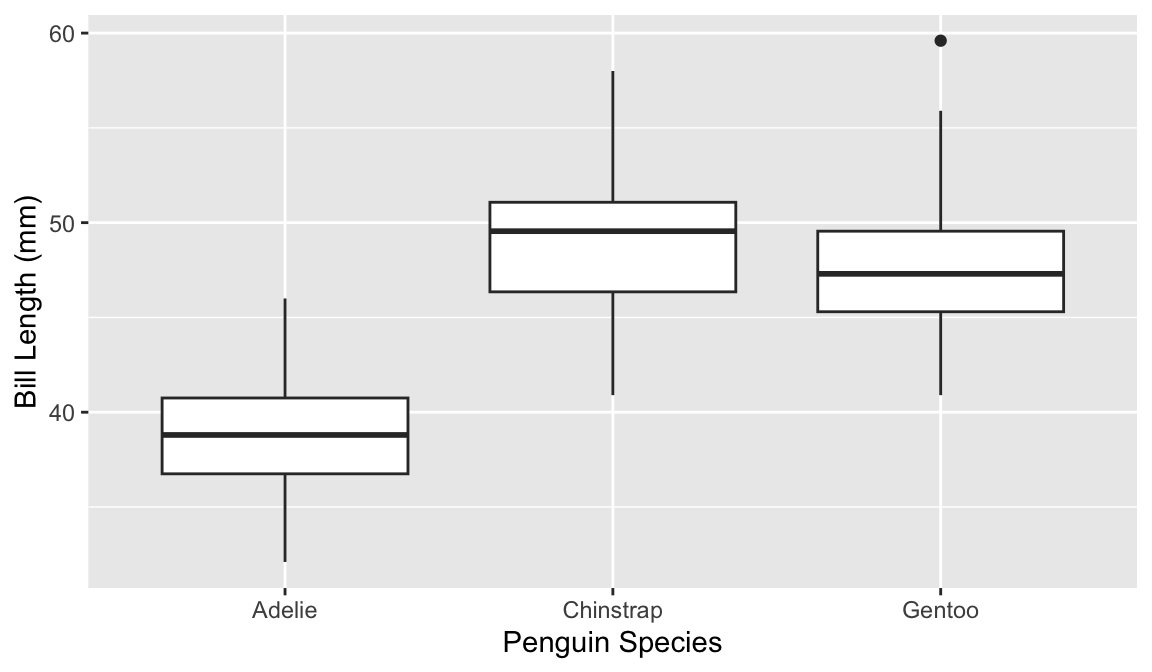
Side-by-Side Boxplots

ggplot(data = penguins,
       mapping = aes(y = bill_length_mm,
                     x = species)) +
  geom_boxplot() + 
  labs(x = "Penguin Species", 
       y = "Bill Length (mm)")

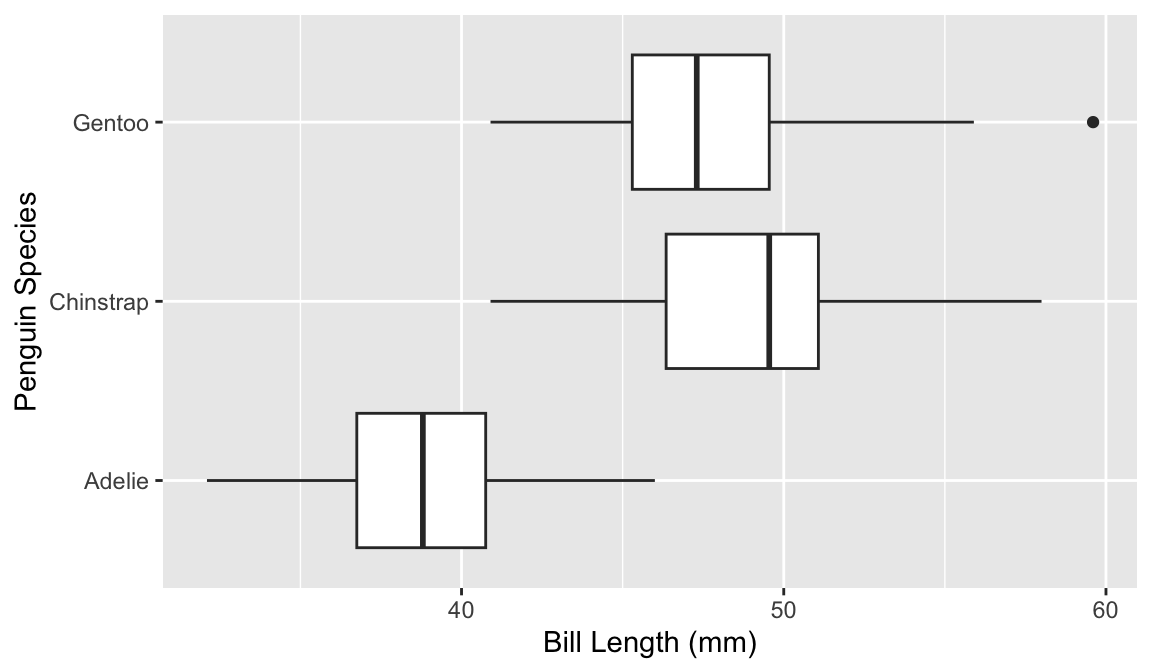
ggplot(data = penguins,
       mapping = aes(x = bill_length_mm,
                     y = species)) +
  geom_boxplot() + 
  labs(y = "Penguin Species", 
      x  = "Bill Length (mm)")

Which do you prefer?

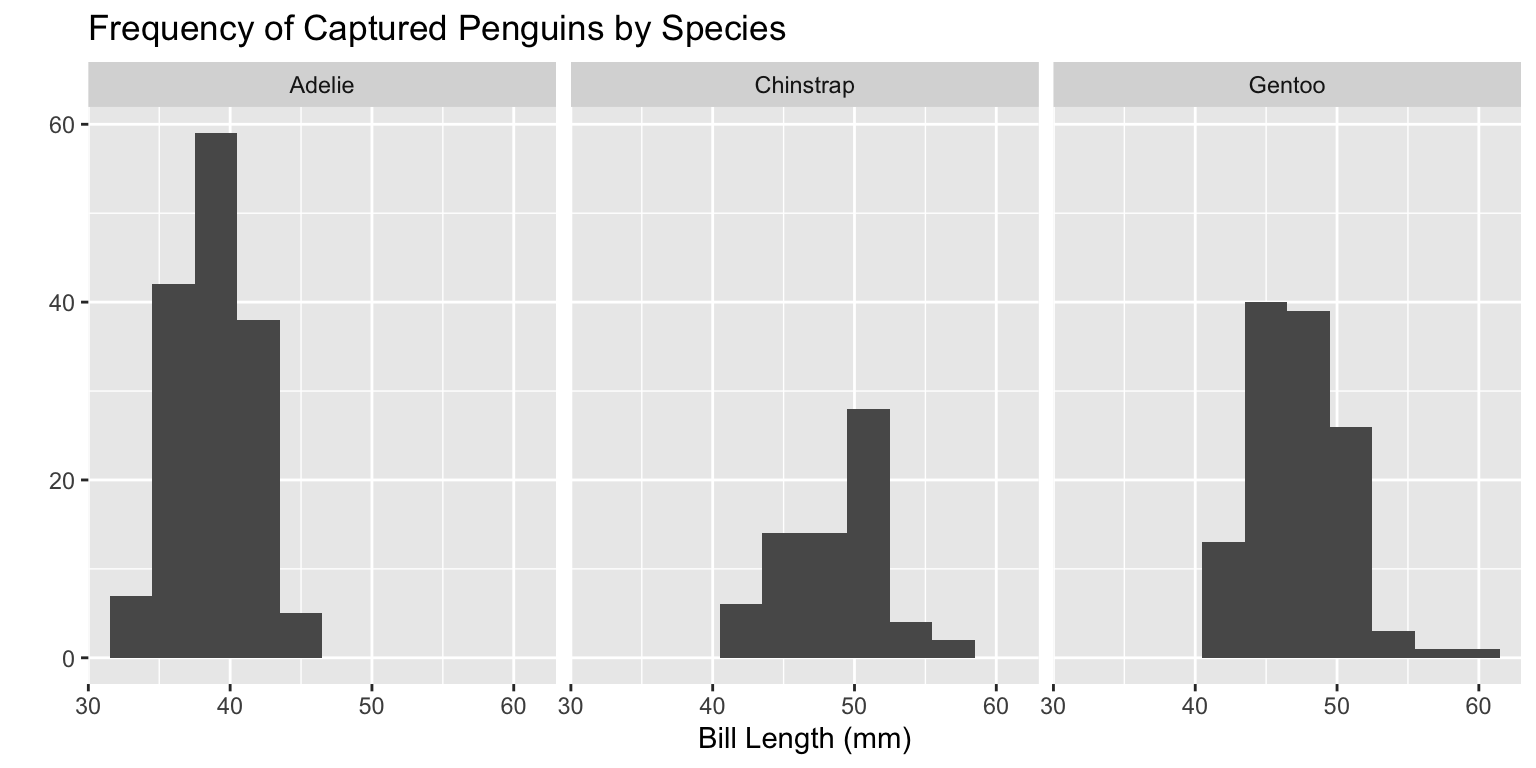
Faceted Histograms

ggplot(data = penguins,
       mapping = aes(x = bill_length_mm)) +
  geom_histogram(binwidth = 3) +
  facet_wrap(~ species) +
  labs(x = "Bill Length (mm)", 
       title = "Frequency of Captured Penguins by Species", 
       y = "")

Faceted Histograms

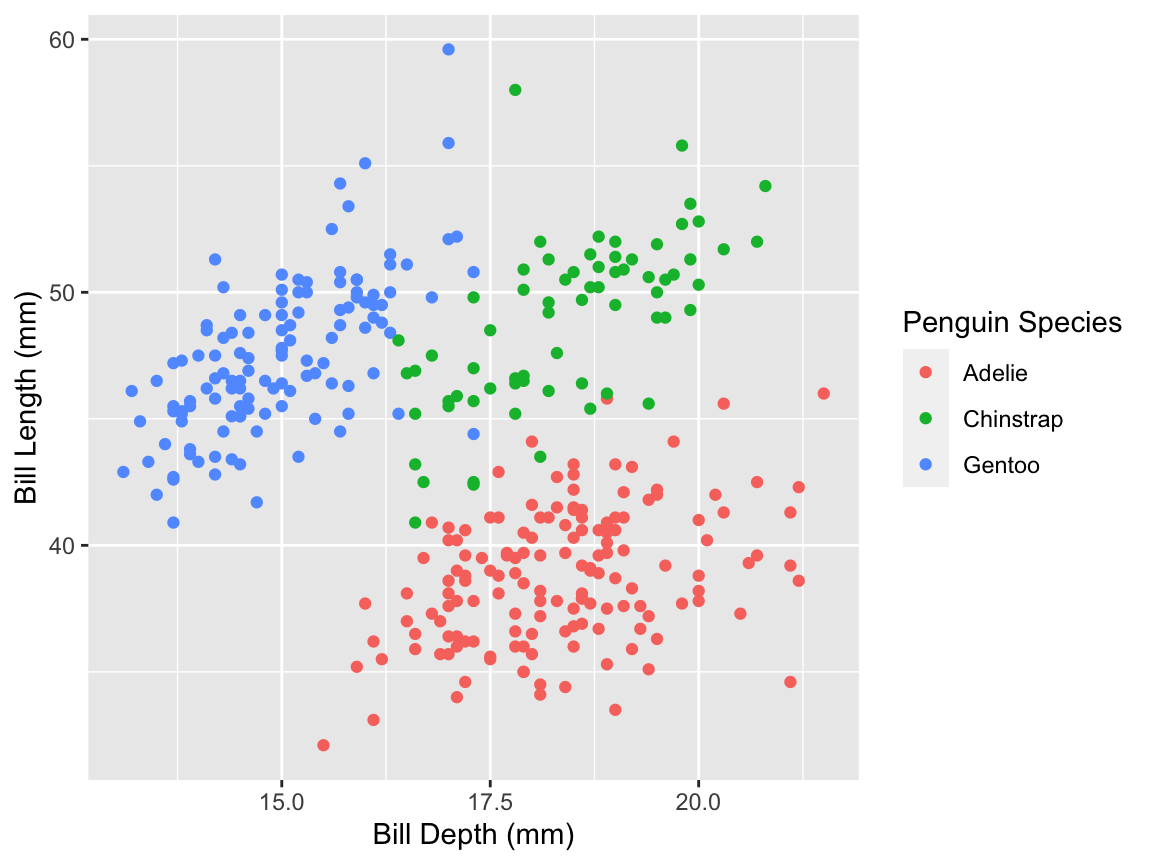
Scatterplots

ggplot(data = penguins,
       mapping = aes(y = bill_length_mm, x = bill_depth_mm)) +
  geom_point() +
  labs(x = "Bill Depth (mm)", 
       y = "Bill Length (mm)")

Scatterplots

Multivariate Plots

There are two main methods for adding a third (or fourth) variable into a data visualization:

Colors

  • creates colors for every level of a categorical variable
  • creates a gradient for different values of a quantitative variable

Facets

  • creates subplots for every level of a variable
  • labels each sub-plot with the value of the variable

Colors in Scatterplots

ggplot(data = penguins,
       mapping = aes(y = bill_length_mm,
                     x = bill_depth_mm,
                     color = species)
       ) +
  geom_point() +
  labs(x = "Bill Depth (mm)", 
       y = "Bill Length (mm)", 
       color = "Penguin Species")

Colors in Scatterplots

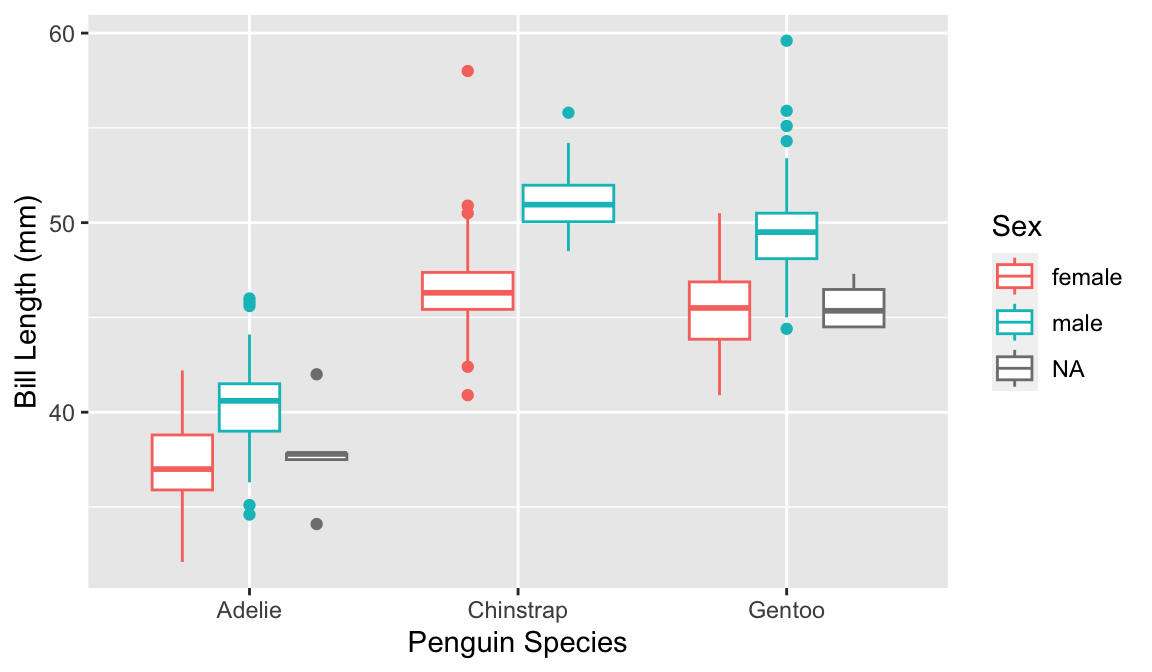
Colors in Boxplots

ggplot(data = penguins,
       mapping = aes(y = bill_length_mm,
                     x = species,
                     color = sex)
       ) +
  geom_boxplot() +
  labs(x = "Penguin Species", 
       y = "Bill Length (mm)", 
       color = "Sex")

Colors in Boxplots

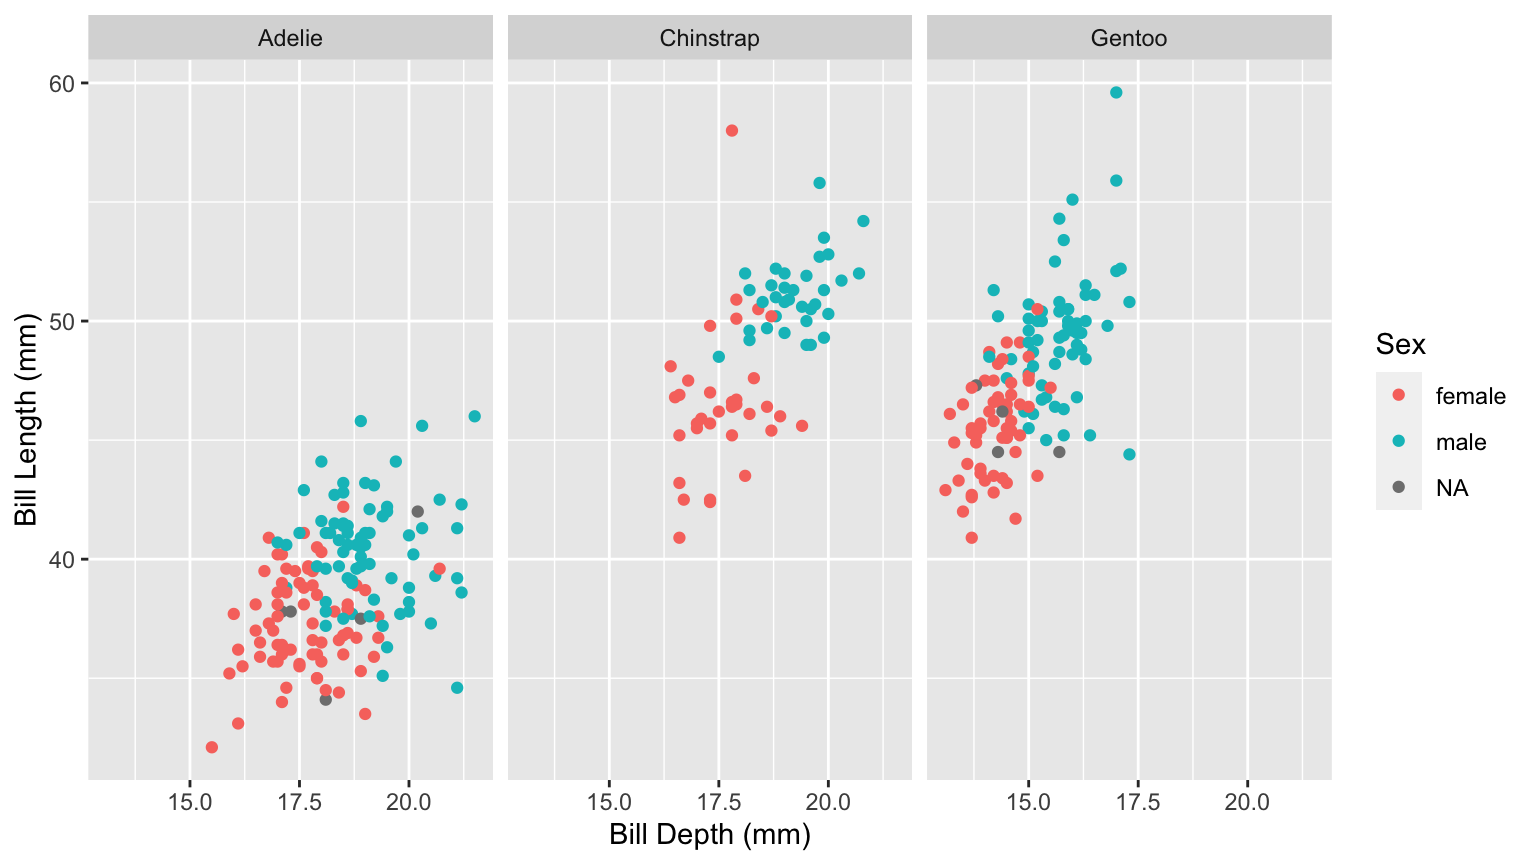
Facets in Scatterplots

ggplot(data = penguins,
       mapping = aes(y = bill_length_mm,
                     x = bill_depth_mm,
                     color = sex)) +
  geom_point() +
  facet_wrap(~ species) + 
  labs(x = "Bill Depth (mm)", 
       y = "Bill Length (mm)", 
       color = "Sex")

Facets in Scatterplots

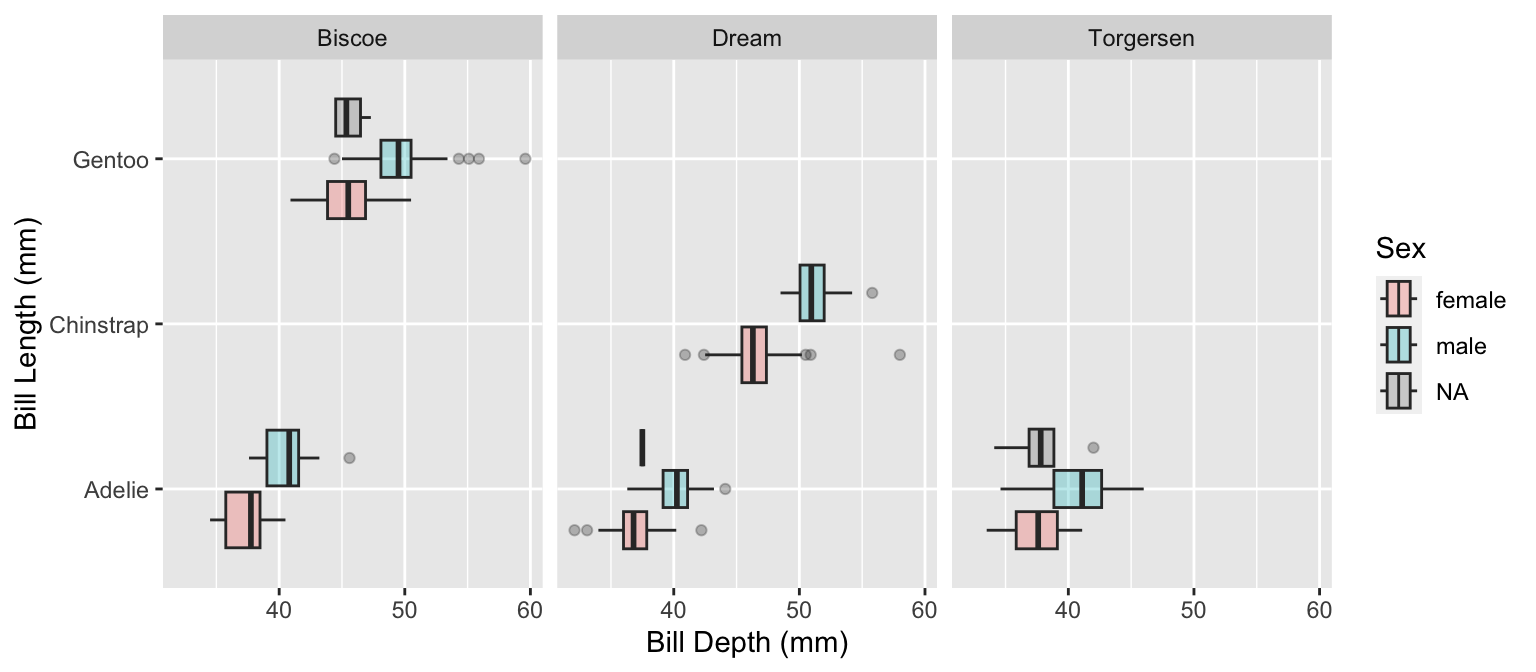
Facets in Boxplots

ggplot(data = penguins,
       mapping = aes(x = bill_length_mm,
                     y = species,
                     fill = sex)) +
  geom_boxplot(alpha = 0.3) +
  facet_wrap(~ island) + 
  labs(x = "Bill Depth (mm)", 
       y = "Bill Length (mm)", 
       fill = "Sex")

Facets in Boxplots

Importing Data

R Projects!

Artwork by @allison_horst

  • Self contained

  • Flag where R should look for files

  • Allow for us to easily use here() to find files

  • Should be how you work in RStudio every time

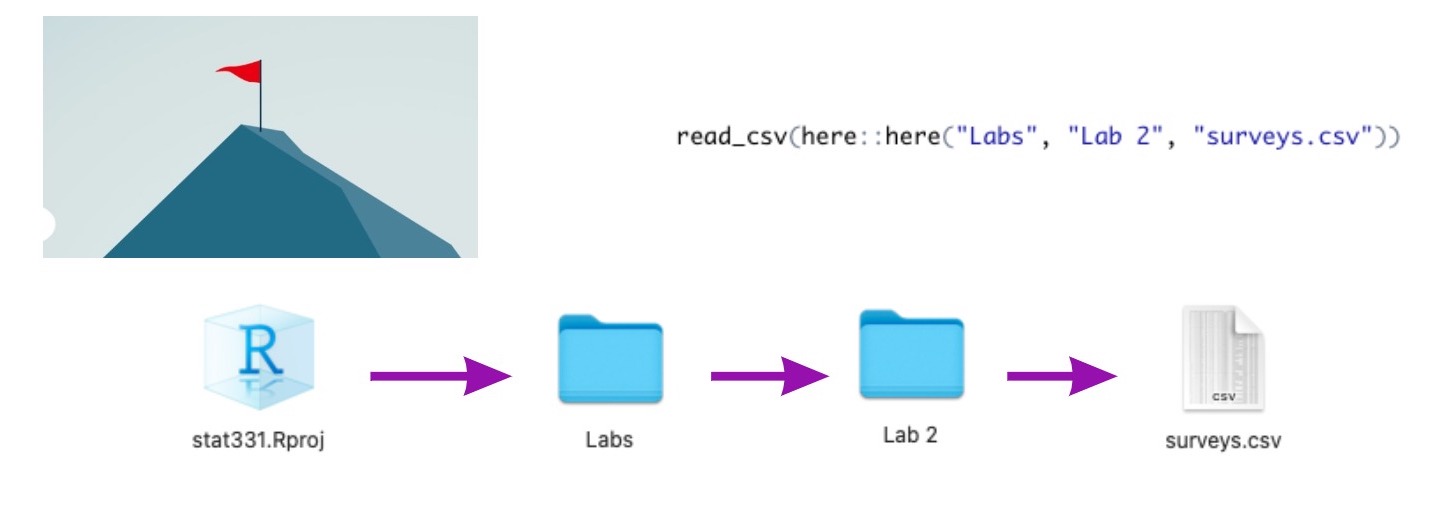
Why use here() to read in your data?

Artwork by @allison_horst

  • Never set a relative / full path or change your working directory!!!
setwd("/Users/atheobol/Documents/Teaching/Stat 331/stat-331-allison")`
  • Working in R? Rendering a document? here() uses the same path to load in data!

Your turn!