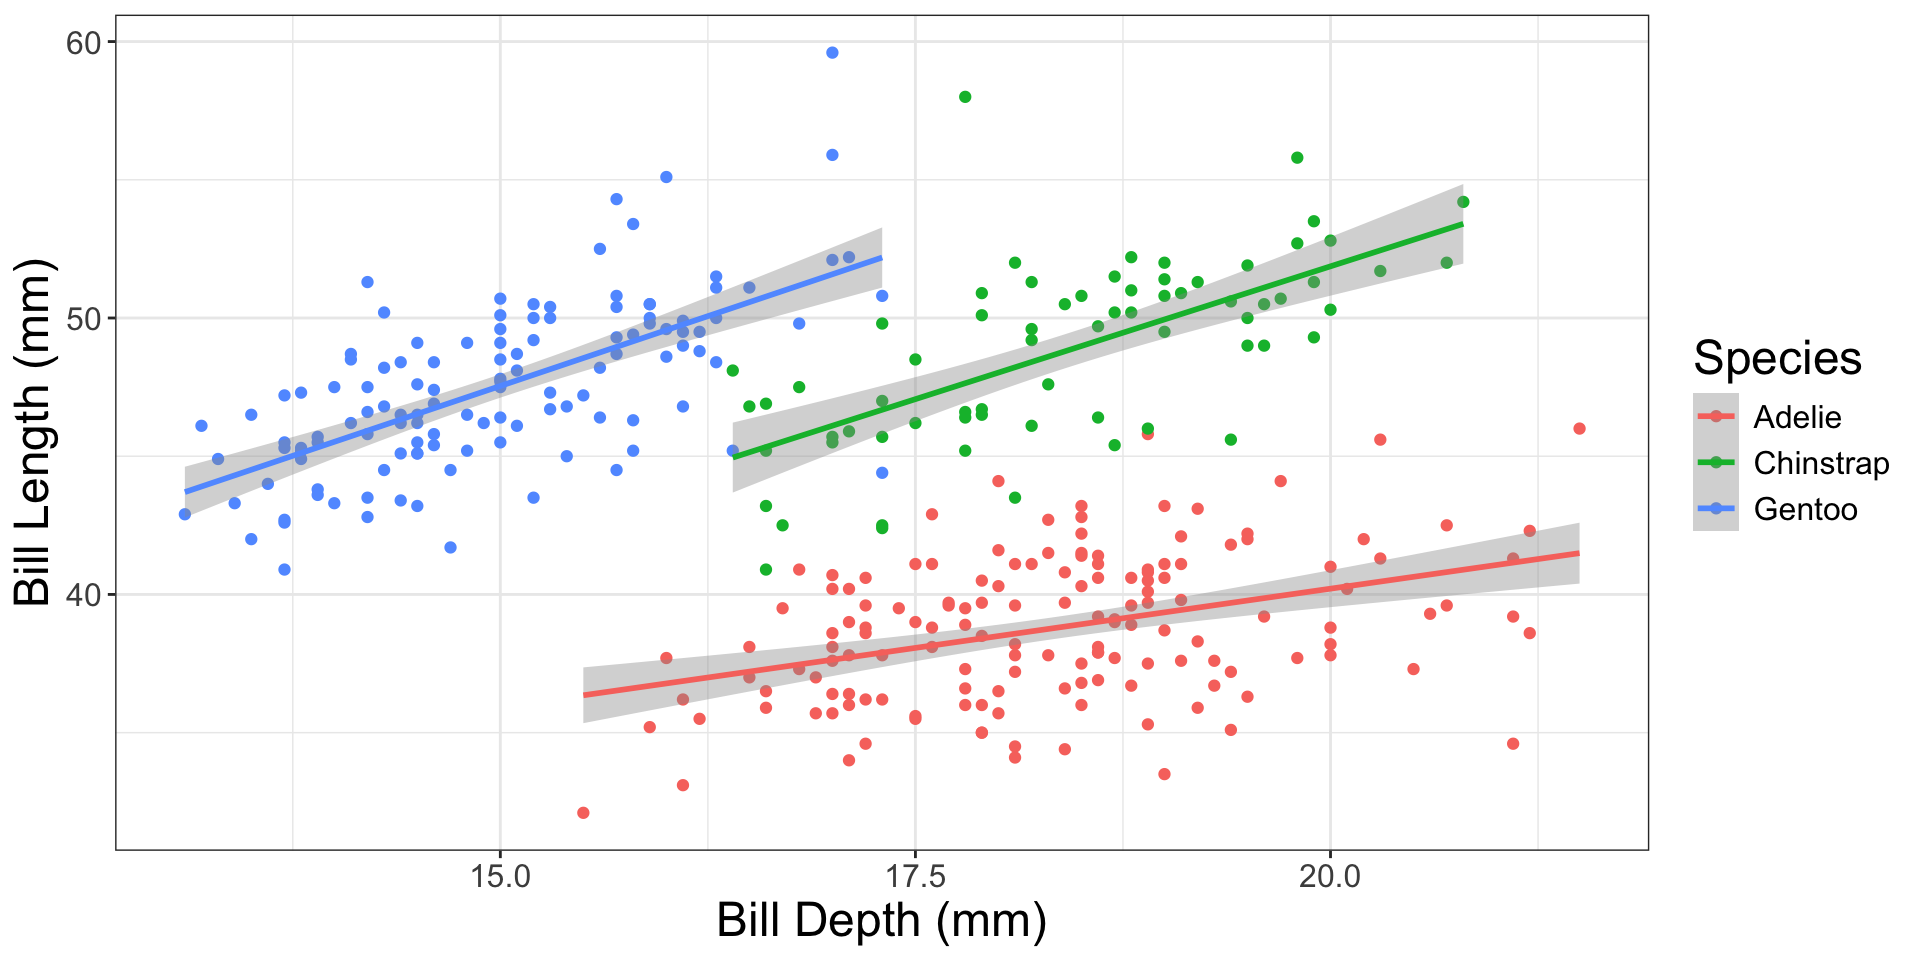
species_lm <- lm(bill_length_mm ~ bill_depth_mm * species,
data = penguins)One-way ANOVA & Multiple Linear Regression
What is the “most complex” model?
Fit the different slopes (interaction) model
Look at the Interaction Line of the ANOVA Table
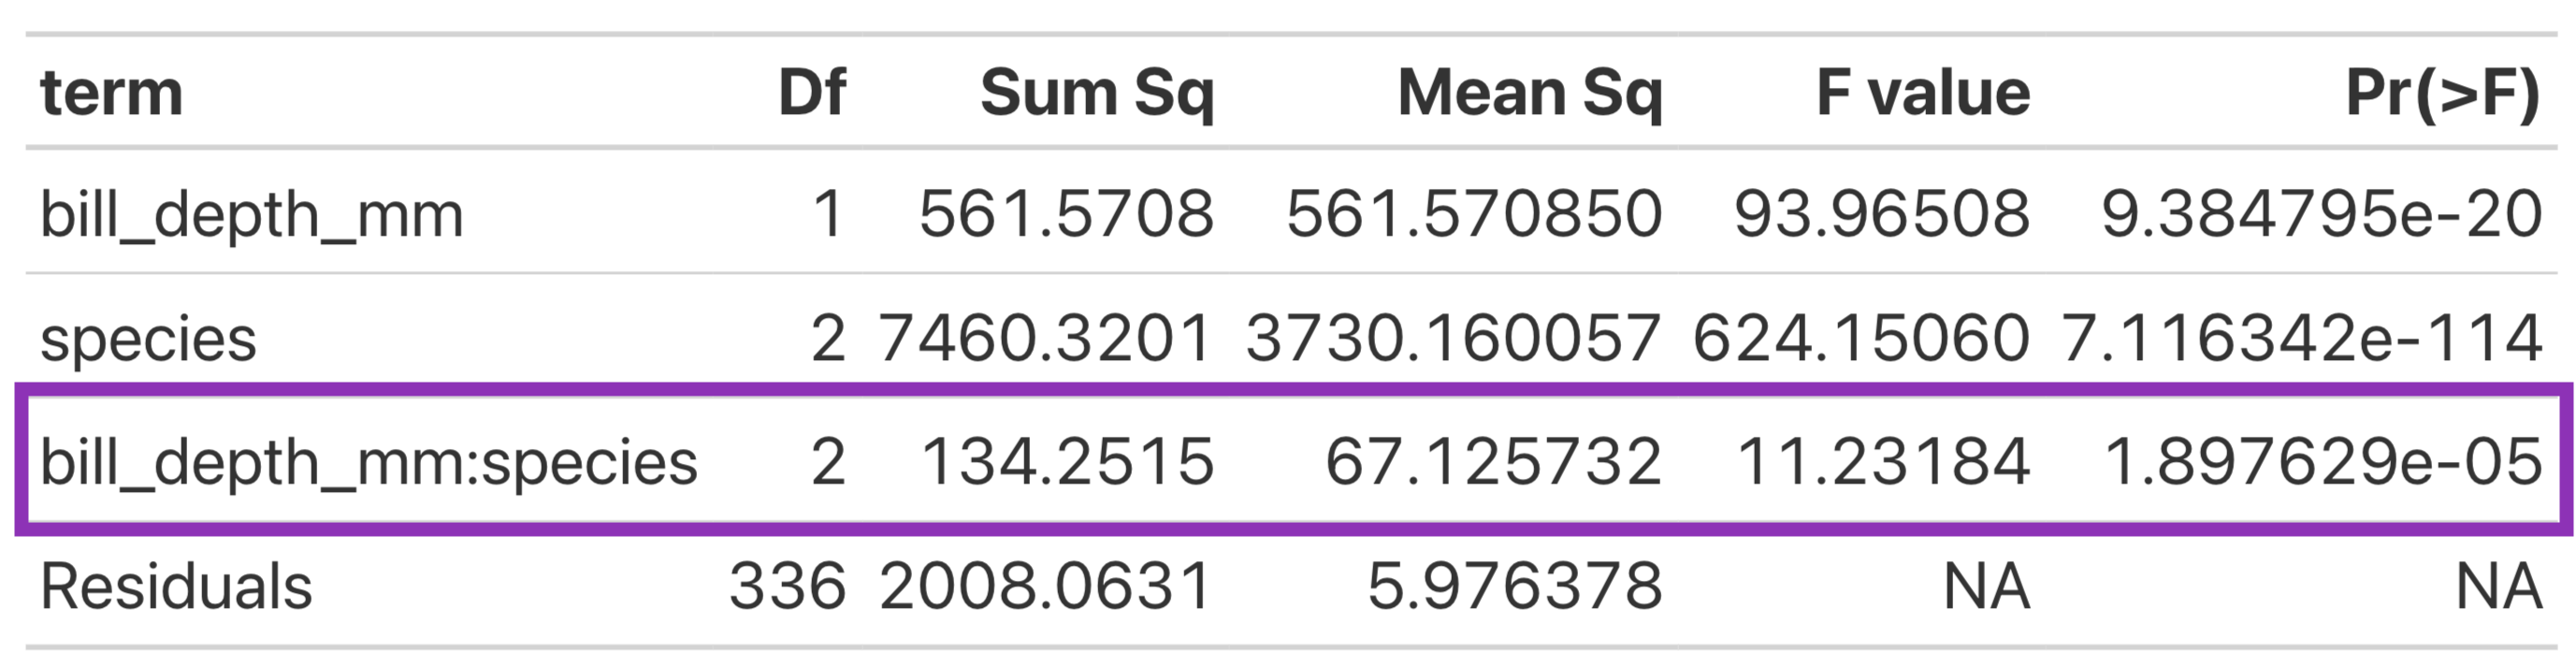
How do I know what model is “best”?
The interaction line of the ANOVA table is testing:
\(H_0\): the slopes for the relationship between bill length and bill depth is the same for all Gentoo, Adelie, and Chinstrap penguins
\(H_A\): the slopes for the relationship between bill length and bill depth is different for at least one species of penguin

What is the relationship between life expectancy and GDP per capita?
- Decide on a variable transformation
- Assess model conditions (L, I, N, E)
- Compare hypothesis test results between simulation-based methods and theory-based methods