Error: <text>:5:0: unexpected end of input
3:   geom_point()
4:
^Exploring Flight Delays
Lab 1
Plotting Your Data
Now that we’ve practiced making some plots, we know…
mapping = aes(y = manufacturer, x = hwy) declares what variables are plotted on the x- and y-axis.
Tip
The variable names you put insides aes() must be identical to the names of the variables in the dataset!
labs(x = "Highway Miles Per Gallon", y = "Car Manufacturer") declares new x-axis and y-axis labels for the plot.
Tip
Including nice axis labels (with their units) is a critical part of every visualization we make!
R Tips and Tricks!
Things you should know before you start coding in the wild.
- R is case sensitive
geom_boxplot()notGeom_boxplot()
- Spelling matters!
nycflightsnotncyflights
- Parentheses are tricky!
- You will want to triple check that each beginning parenthesis
(has a counterpart).
- You will want to triple check that each beginning parenthesis
Lab 2
Departure Delays
- Inspect the
nycflightsdataset - Visualize departure delays
- Play with histogram
binwidth filter()data to include only certain flightscalculate()summary statistics- Make decisions based on summary statistics
- Compare summary statistics to a visualization
Working in Groups

Cooperative Learning
is a structured form of small-group learning.
Roles relate to how the work should be done
- Roles are not about breaking up the work intellectually
Roles allow each person to contribute to the group in significant ways
- Each person’s participation is necessary to complete the task
Group Roles
Recorder – Manages in-class report
- Talks with Resource Manager about ideas related to ways they could solve the problem.
- Responsible for organizing and recording answers to the assignment during discussions.
- Compiles a summary of the solutions discussed.
- Submits final assignment.
Resource Manager – Manages resources for coding / statistical tasks
- Reads prompt and ensures Recorder understands what the problem is asking.
- Asks group questions to Dr. Theobold.
- Manages resources (e.g., cheatsheets, textbook, tutorials) for aiding in solution strategy.
- Leads discussion and encourages participation from Recorder.
- Brings conversation back if it deviates.
Group Roles
Recorder – Manages in-class report
- Does not ask the Resource Manager to solve the problem.
- Does not ask the Resource Manager to write the code for them.
Resource Manager – Evaluates solution strategy
- Does not solve the problem themselves.
- Does not tell the Recorder what to type.
- Does not type for the Recorder.
Helping someone means explaining your thinking not giving answers or doing the work for them
Provide a justification when you make a statement
Think and work together – don’t divide up the work
No cross talk with other groups
Find Your Group!

Accessing Lab 1
Step 1: Both members of your group need to follow these instructions to join your group workspace.
Roles
The person who was assigned to be the group “leader” will act as the Recorder for your group (this week).
Step 2: The Recorder follows these instructions to copy the Lab 2 project into your group’s workspace
Step 3: Both members open the Lab 2 assignment in your group workspace!
Step 4: Follow the final instructions to activate collaborative editing in the document.
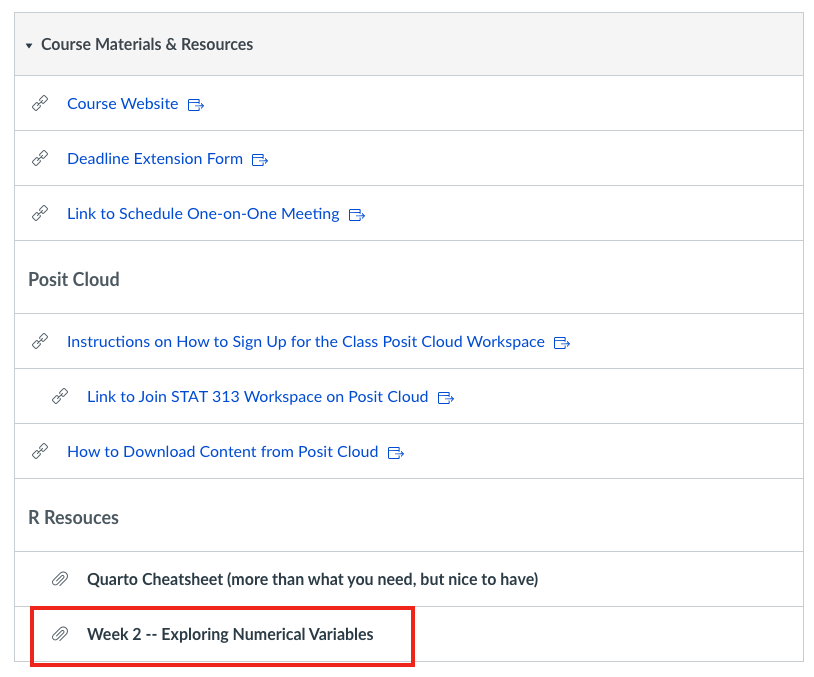
R Resources