| subject | sex | age | trait | target | stereotype | high_achieve_caution |
|---|---|---|---|---|---|---|
| 140 | male | 5 | nice | adults | 1.00 | 0.25 |
| 68 | female | 5 | nice | children | 0.50 | 1.00 |
| 65 | male | 7 | smart | adults | 0.00 | 0.75 |
| 65 | male | 7 | nice | children | 0.00 | 0.75 |
| 9 | male | 5 | nice | adults | 0.00 | 0.50 |
| 8 | female | 6 | smart | children | 0.25 | 0.75 |
Welcome to Stat 313!
Warm-up
(90 seconds)
Why do you believe your discipline requires / expects you to take this course?
Who am I?
About Me…


What can I expect from this class?
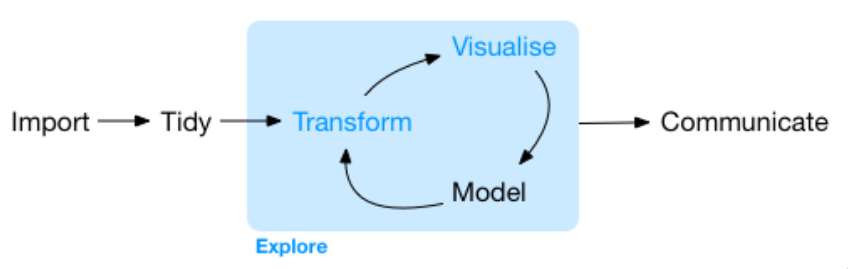
What is Statistics?
Scientists seek to answer questions using rigorous methods and careful observations. These observations – collected from the likes of field notes, surveys, and experiments – form the backbone of a statistical investigation and are called data.
Statistics is the study of how best to collect, analyze, and draw conclusions from data.
Introduction to Modern Statistics
What Statistics Is To Me
What you can expect in STAT 313
This course will teach you the fundamentals of linear models—simple linear regression, multiple linear regression, and analysis of variance—and experimental design. You will extend the concepts covered in your Stat I course, to:
- work with data in a reproducible way (using R)
- visualize and summarize a variety of datasets (in R)
- critically evaluate the use of Statistics
- perform statistical analyses to answer research questions (using R)
Coding 🙀
Coding is a huge part of how doing statistics in the wild looks.
- Everyone is coming from a different background
- Different aspects of the course will be difficult to different people
- You will be given coding resources each week
- Use your peers to support your learning
Course Components
Before Class
- Reading Guides
- Concept Quizzes
- R Tutorials
During Class
- Group Discussion
- Hands-on Activities
- Lab Assignments
Outside of Class
Statistical Critiques
Midterm Project
Final Project
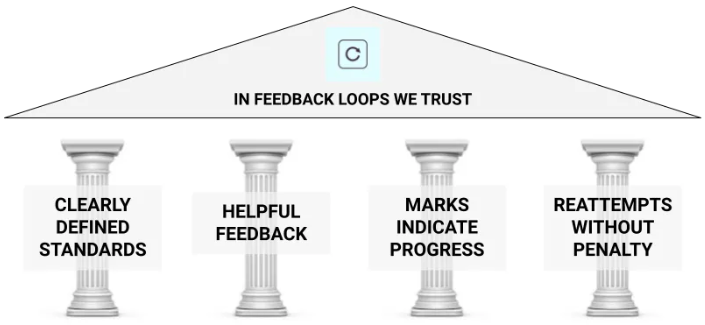
Specifications Based Grading
Let’s talk about data…
Tidy Data
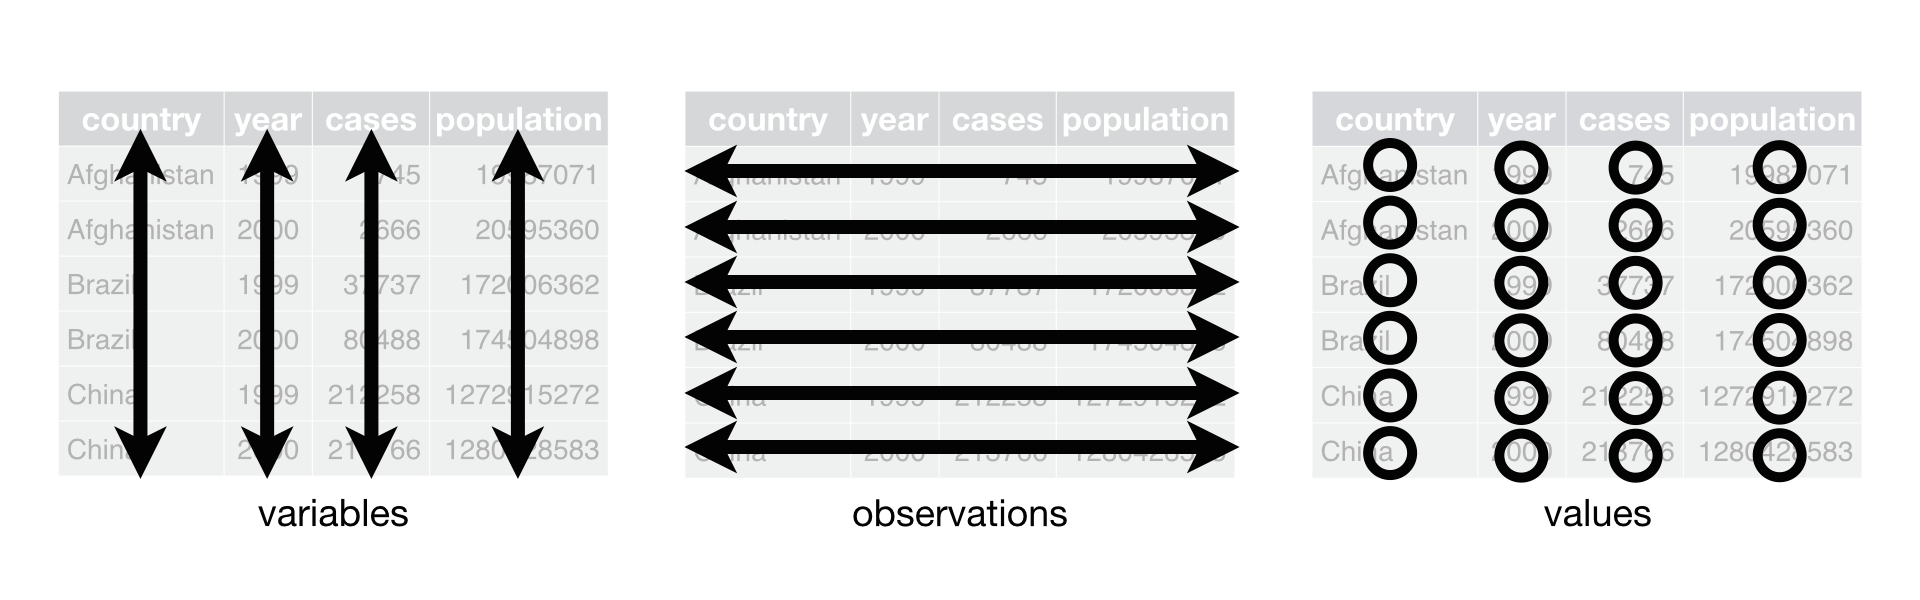
Expected layout of “tidy” datasets
Gender Stereotypes
What are the observations in these data? i.e., What separates one row from the other rows?
Body Girth and Skeletal Diameter
| age | wgt | hgt | sex | sho_gi | wai_gi | nav_gi | hip_gi |
|---|---|---|---|---|---|---|---|
| 45 | 58.6 | 166.2 | 0 | 102.5 | 69.5 | 75.5 | 95.3 |
| 27 | 85.5 | 198.1 | 1 | 117.9 | 82.5 | 90.8 | 94.9 |
| 19 | 47.0 | 160.0 | 0 | 89.2 | 61.0 | 73.0 | 82.5 |
| 26 | 82.7 | 177.8 | 1 | 121.8 | 85.0 | 90.8 | 97.9 |
| 29 | 53.9 | 167.4 | 1 | 102.9 | 75.4 | 78.0 | 88.6 |
| 36 | 55.2 | 165.1 | 0 | 96.4 | 68.3 | 88.0 | 93.8 |
What are the observations in these data?
NBA Player of the Week
| Age | Date | Draft Year | Height | Player | Position |
|---|---|---|---|---|---|
| 33 | Mar 16, 1997 | 1985 | 6-9 | Karl Malone | PF |
| 32 | Nov 21, 2004 | 1994 | 6-8 | Grant Hill | SF |
| 25 | Mar 23, 2003 | 1996 | 6-10 | Peja Stojakovic | F |
| 27 | Dec 19, 2016 | 2009 | 201cm | DeMar DeRozan | GF |
| 29 | Apr 7, 2014 | 2004 | 6-10 | Al Jefferson | FC |
| 28 | Dec 26, 2016 | 2011 | 175cm | Isaiah Thomas | PG |
What are the observations in these data?
Your Turn
Every year, the US releases to the public a large data set containing information on births recorded in the country.
A total of 12 variables were collected on every birth, including information about:
- the birth (baby weight, sex of baby, premie status)
- the pregnancy (hospital visits, length of gestation, weight gained)
- the birth parent’s attributes (age, high-risk status, smoking status, marital status, race)
- the partner’s age
If you were to open this dataset in Excel, how would you expect it to look?
Military Spending
| Country | 2010 | 2011 | 2012 | 2013 | 2014 | 2015 | 2016 | 2017 | 2018 | 2019 |
|---|---|---|---|---|---|---|---|---|---|---|
| Africa | NA | NA | NA | NA | NA | NA | NA | NA | NA | NA |
| USA | 4.922642 | 4.840174 | 4.477401 | 4.046679 | 3.695891 | 3.477846 | 3.418941 | 3.313385 | 3.316244 | 3.413107 |
| Australia | 1.856791 | 1.757078 | 1.670963 | 1.639861 | 1.772211 | 1.950601 | 2.081512 | 1.997974 | 1.894180 | 1.879802 |
| Norway | 1.515698 | 1.451436 | 1.402134 | 1.413997 | 1.472039 | 1.507280 | 1.626681 | 1.622270 | 1.628300 | 1.684120 |
| Sweden | 1.188288 | 1.104288 | 1.133304 | 1.116715 | 1.129776 | 1.069579 | 1.052833 | 1.024075 | 1.031100 | 1.120599 |
Do these data satisfy the “tidy” principles?
Vehicle Efficiency
| mpg | cyl | disp | hp | drat | wt | qsec | vs | am | gear | carb | |
|---|---|---|---|---|---|---|---|---|---|---|---|
| Merc 450SLC | 15.2 | 8 | 275.8 | 180 | 3.07 | 3.780 | 18.00 | 0 | 0 | 3 | 3 |
| Duster 360 | 14.3 | 8 | 360.0 | 245 | 3.21 | 3.570 | 15.84 | 0 | 0 | 3 | 4 |
| Merc 280 | 19.2 | 6 | 167.6 | 123 | 3.92 | 3.440 | 18.30 | 1 | 0 | 4 | 4 |
| Mazda RX4 Wag | 21.0 | 6 | 160.0 | 110 | 3.90 | 2.875 | 17.02 | 0 | 1 | 4 | 4 |
Do these data satisfy the “tidy” principles?
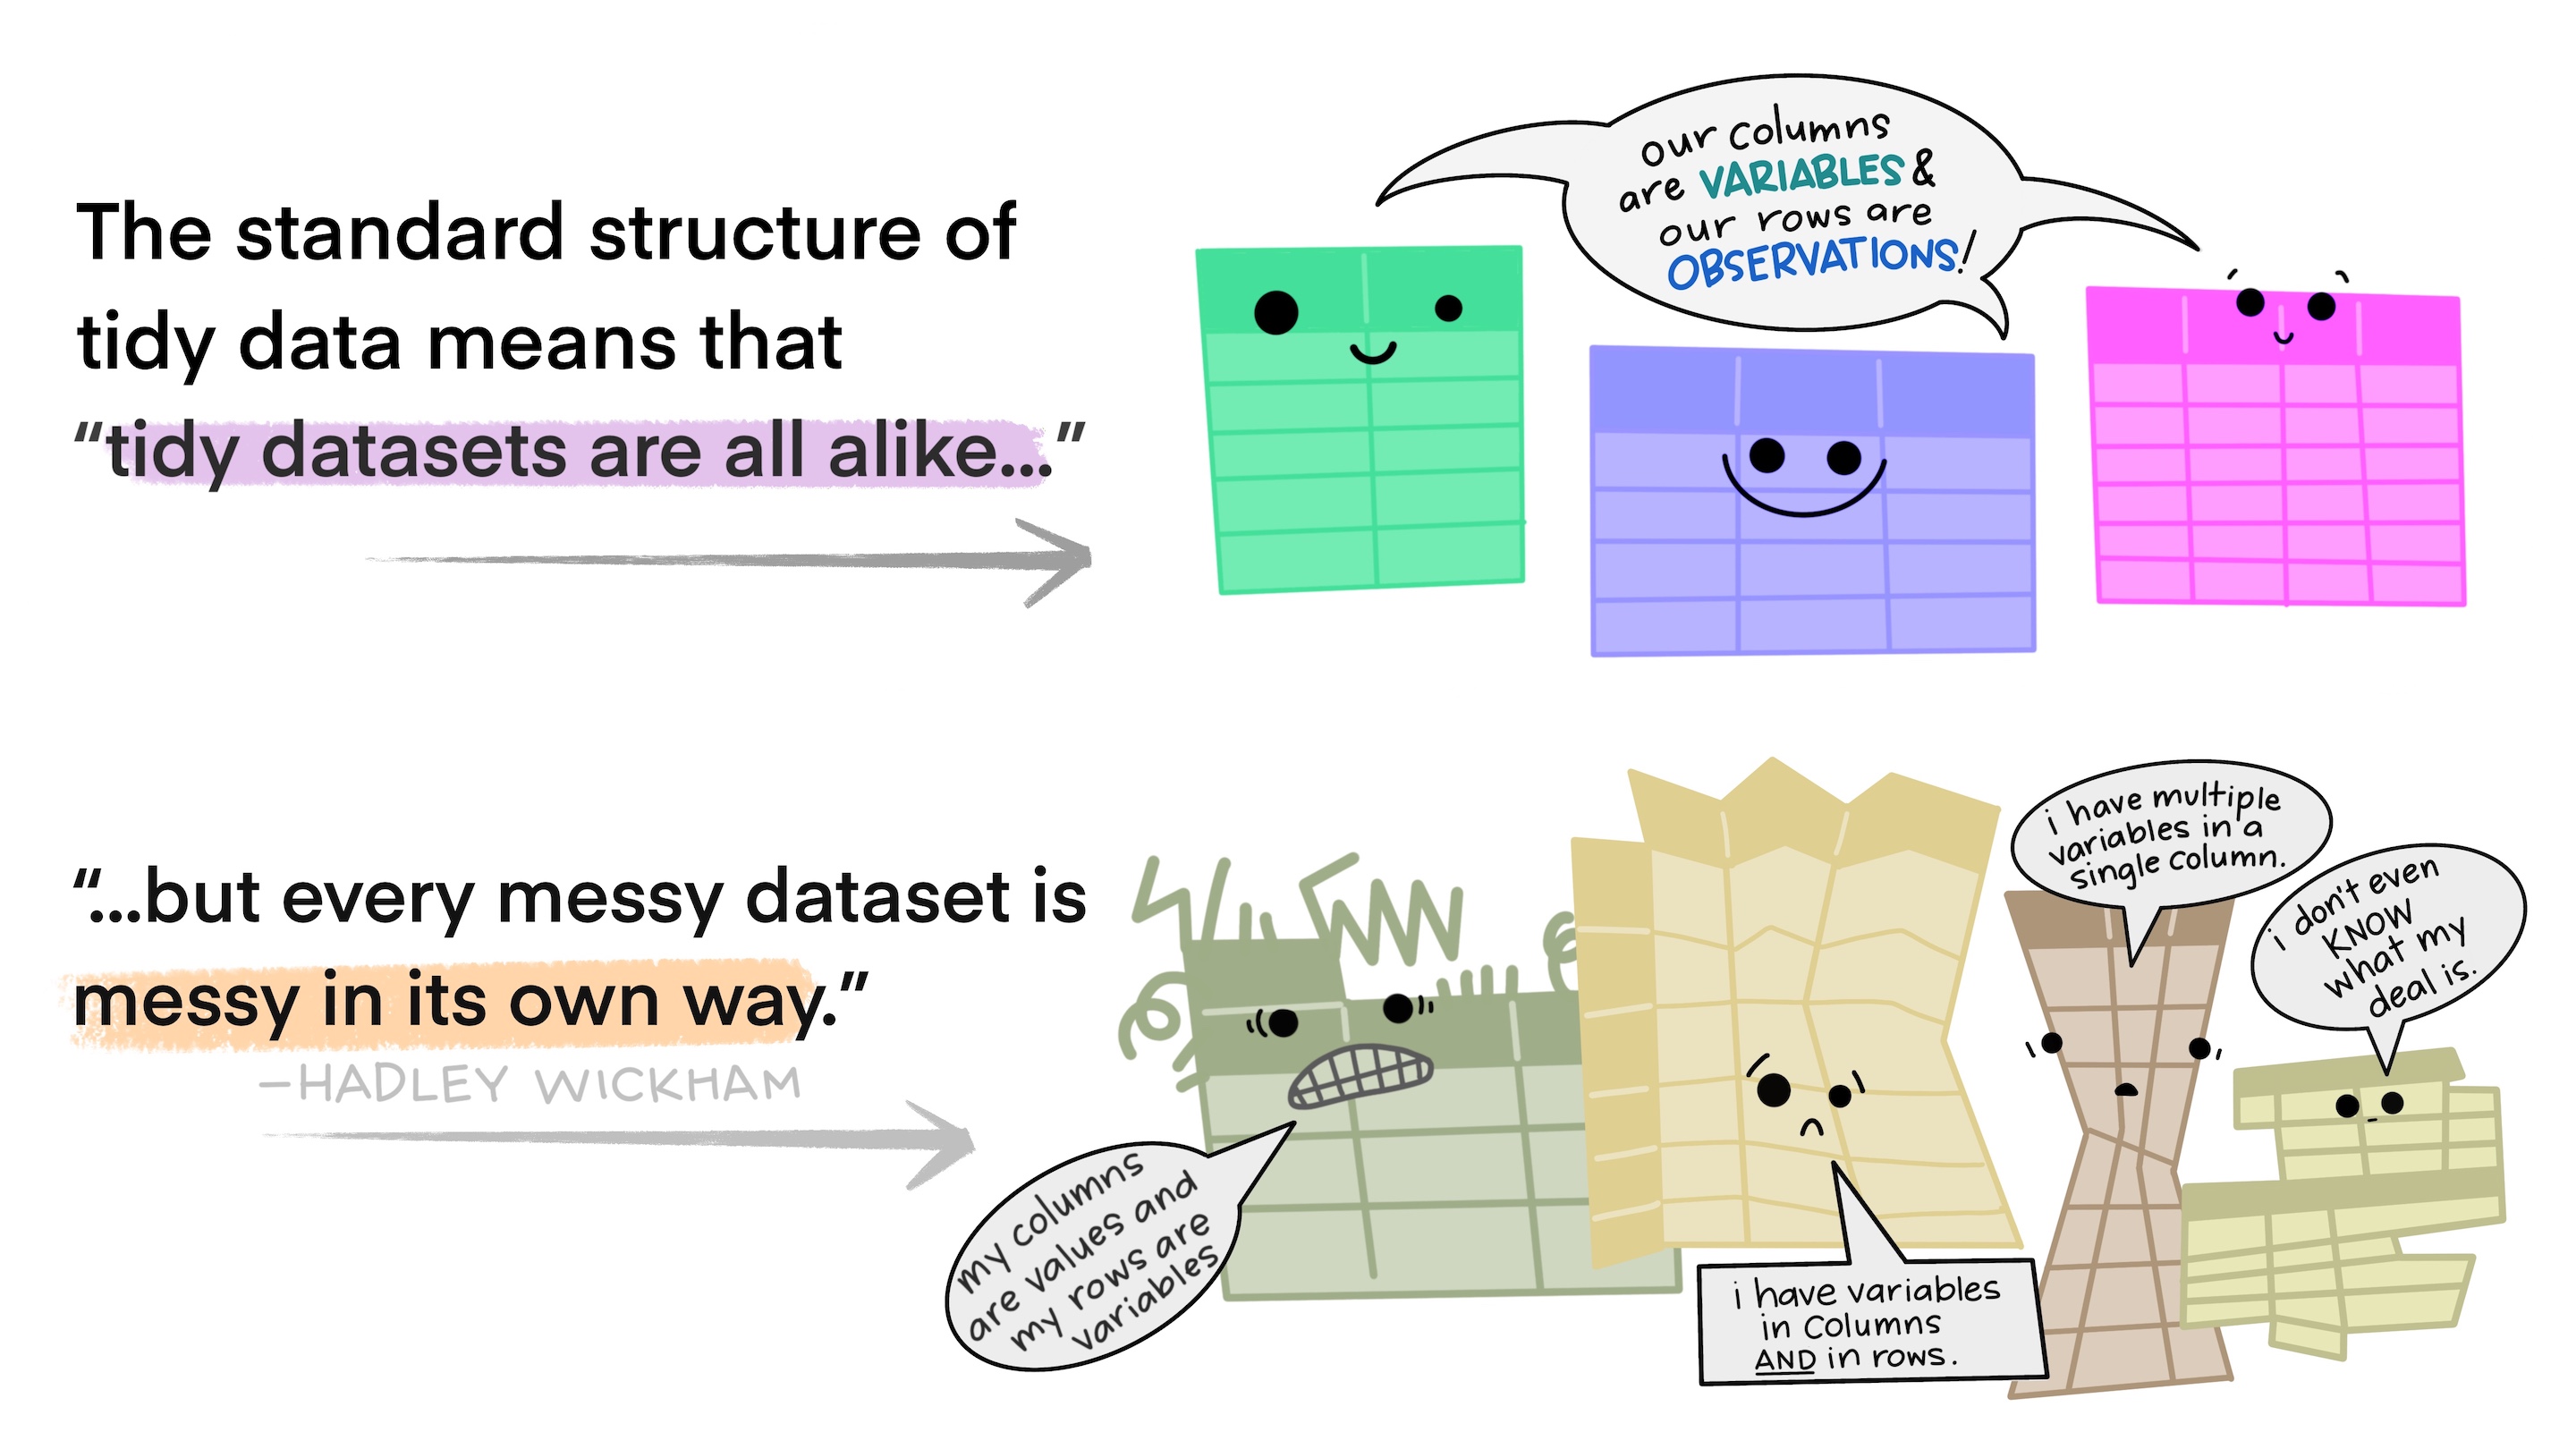
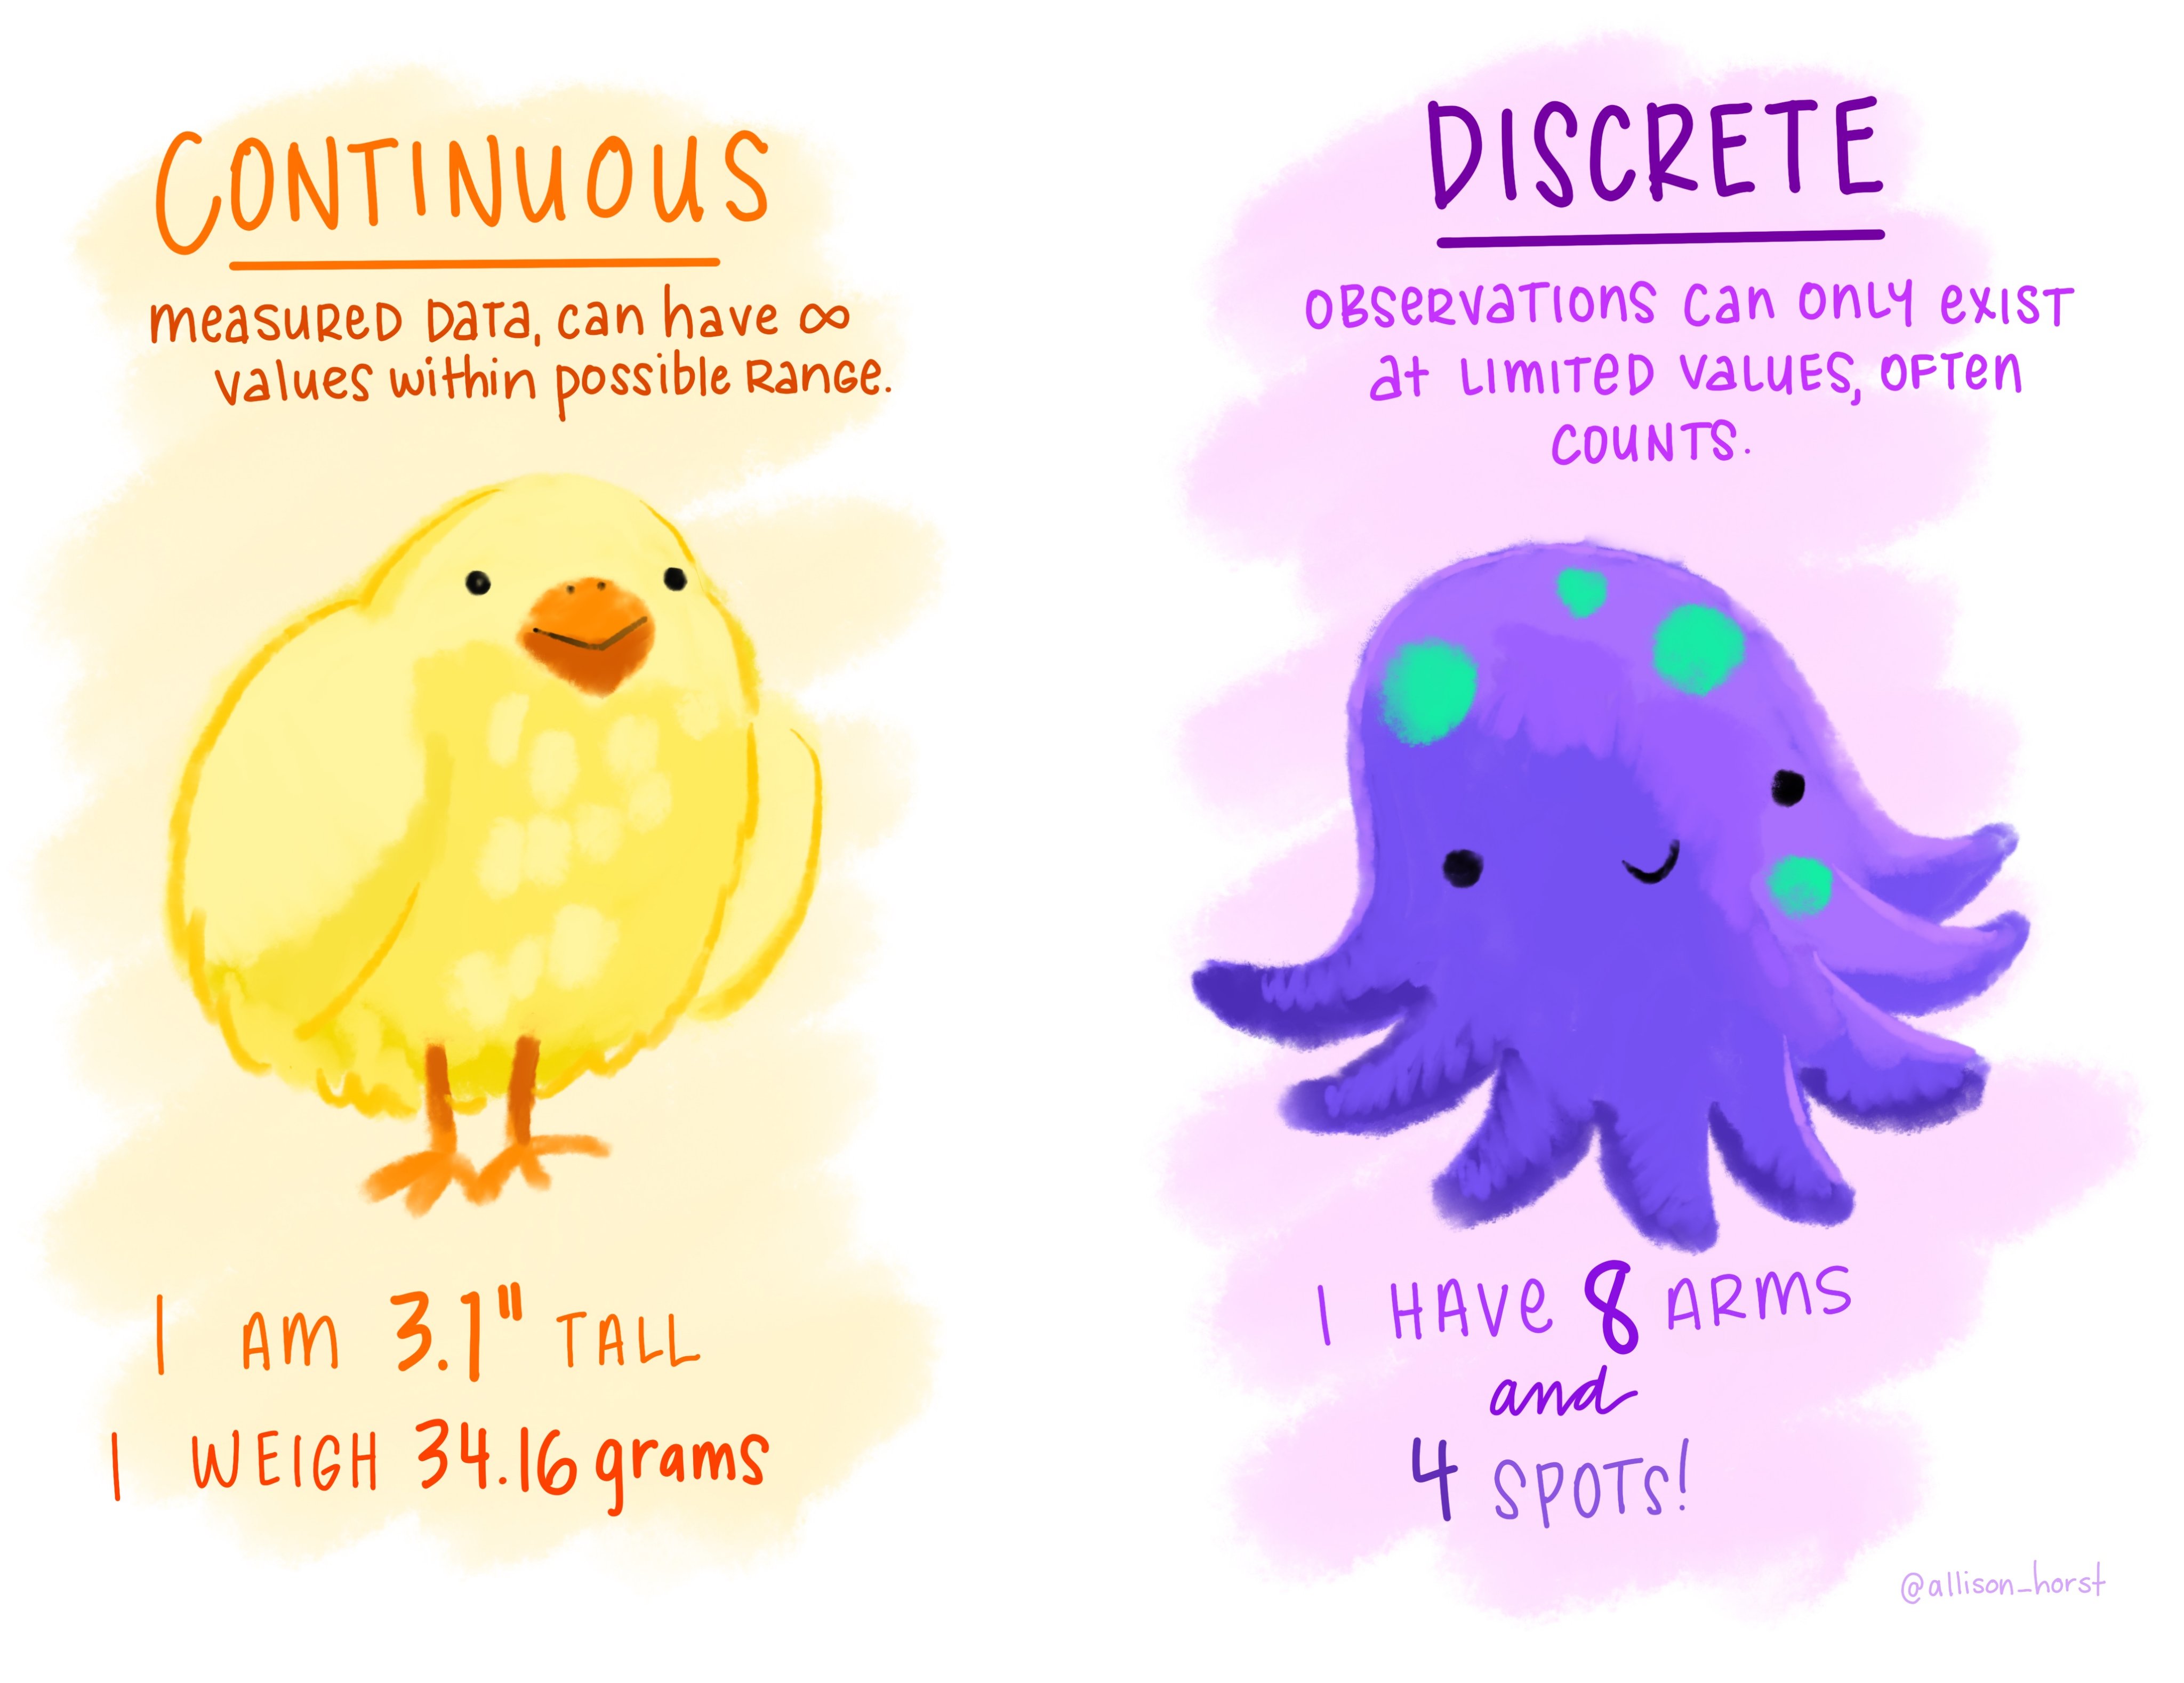
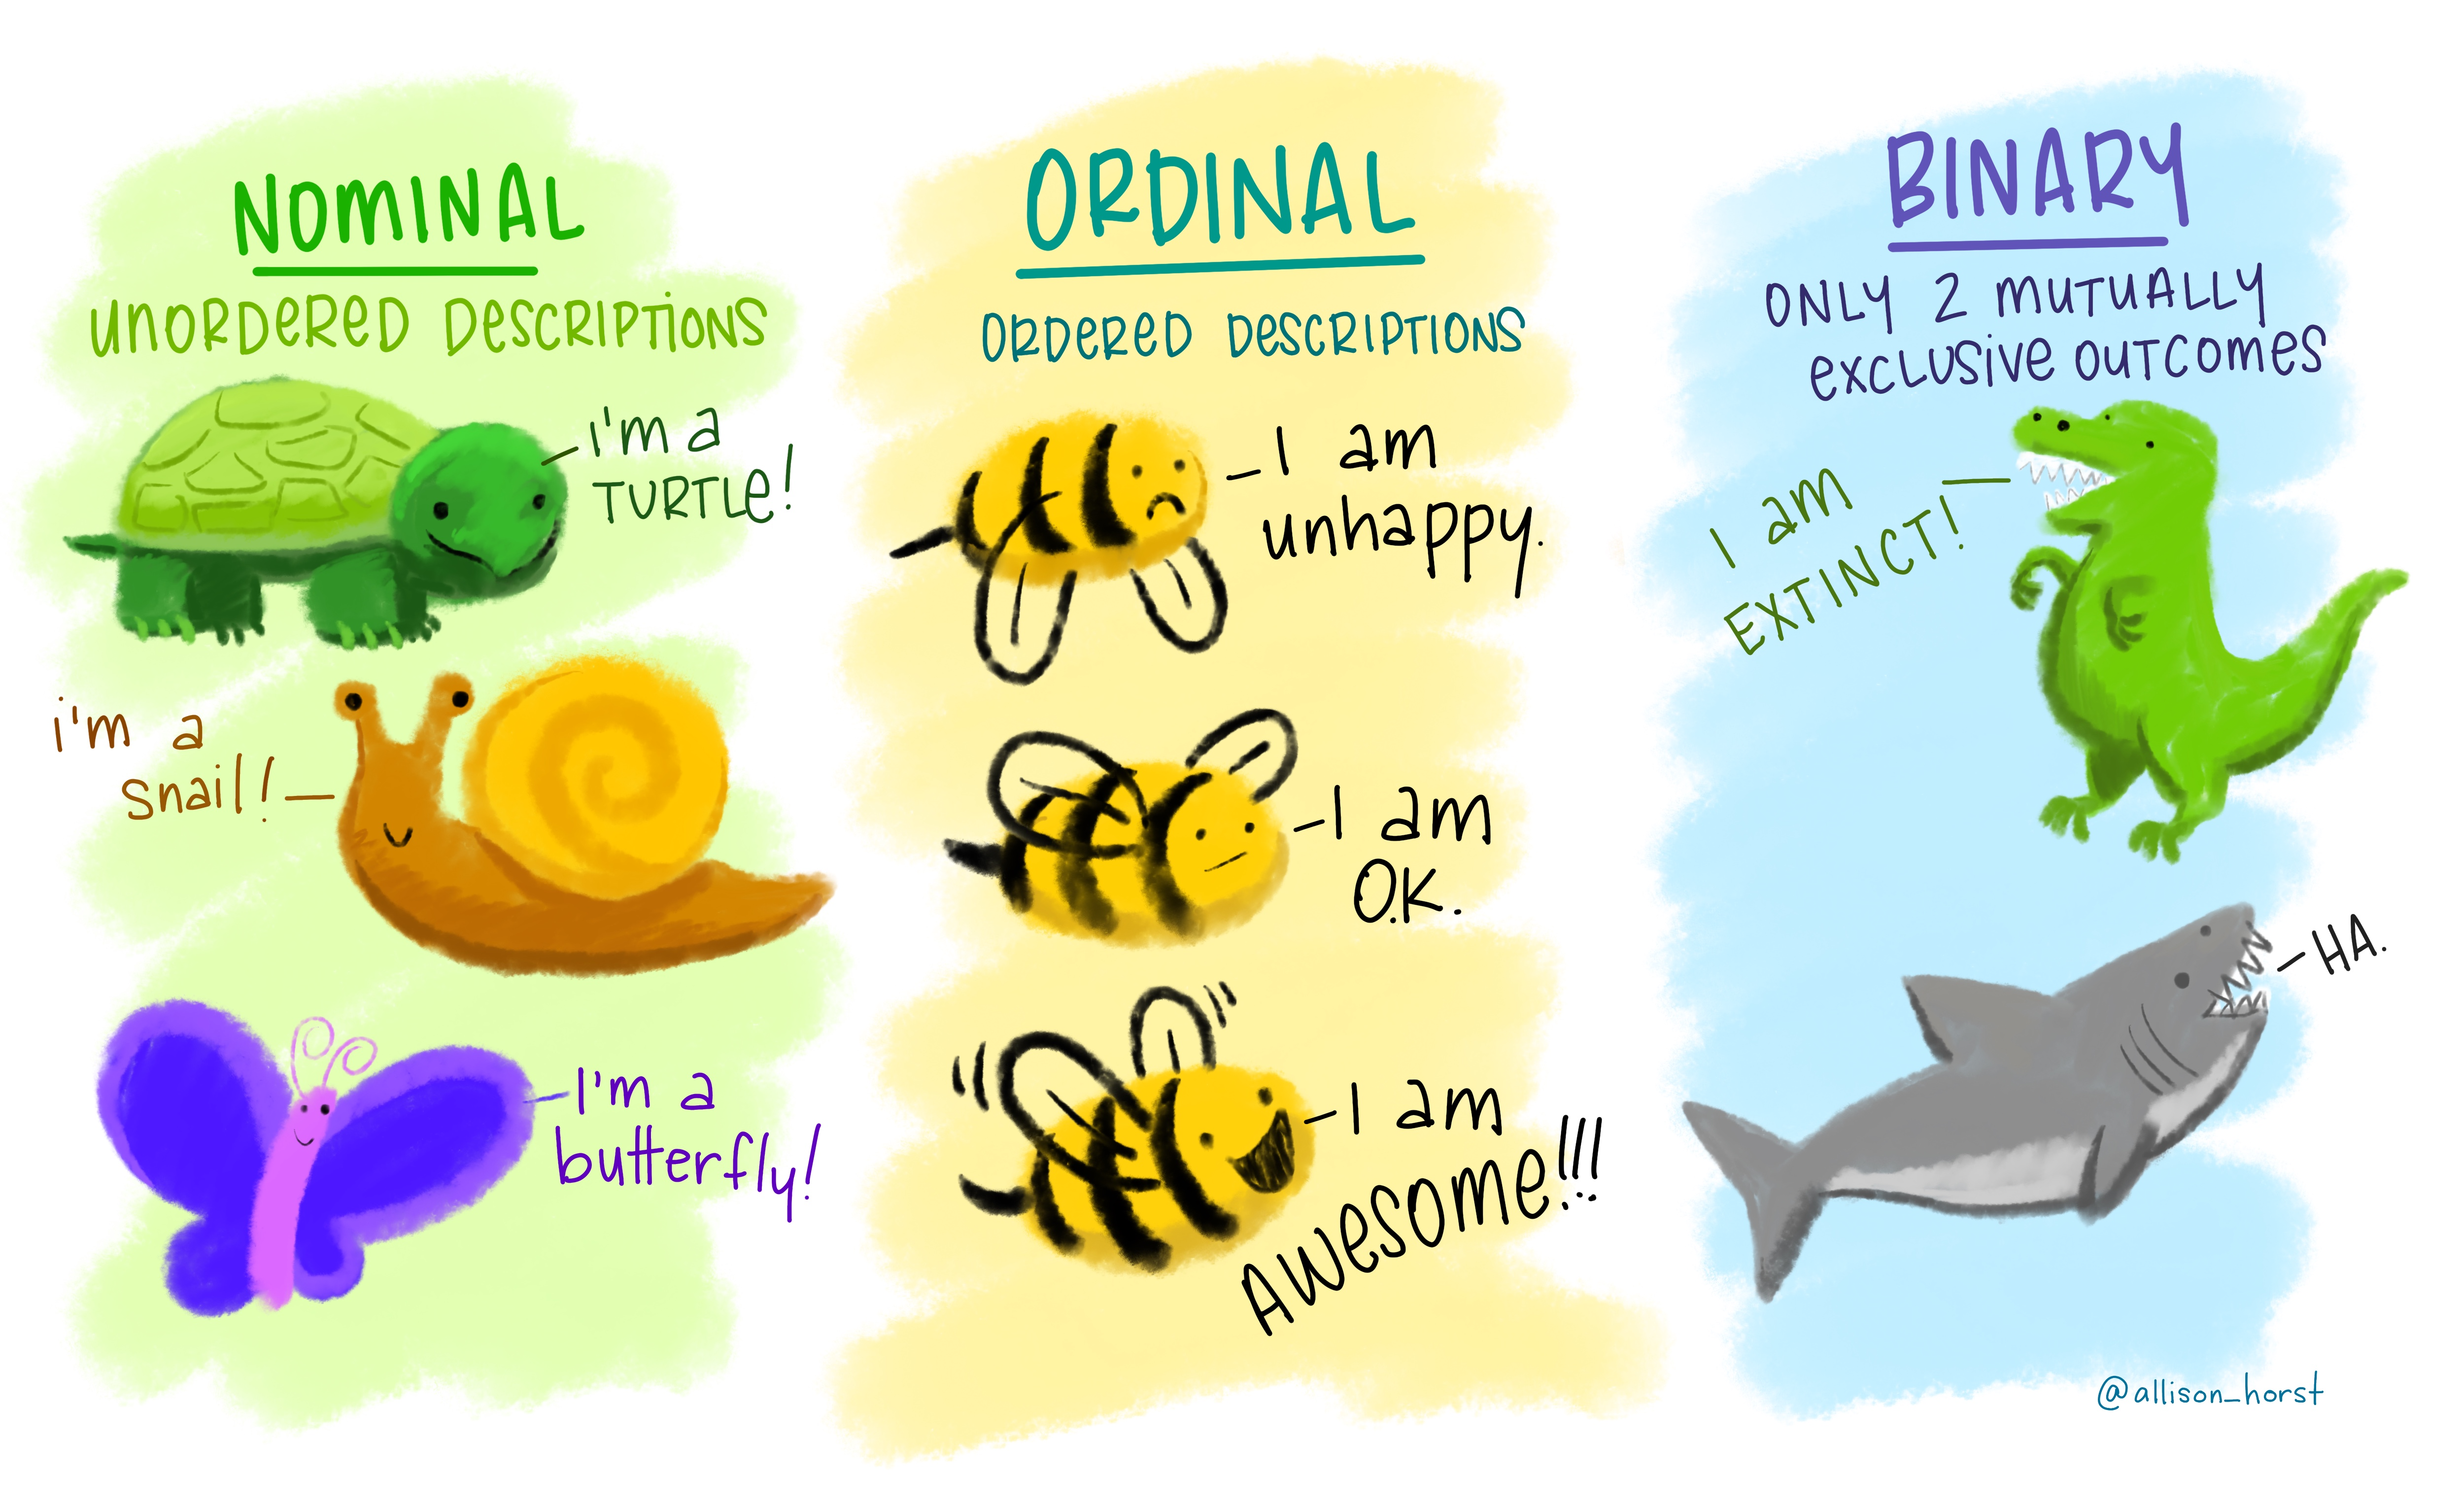
Artwork by @allison_horst
Types of Variables
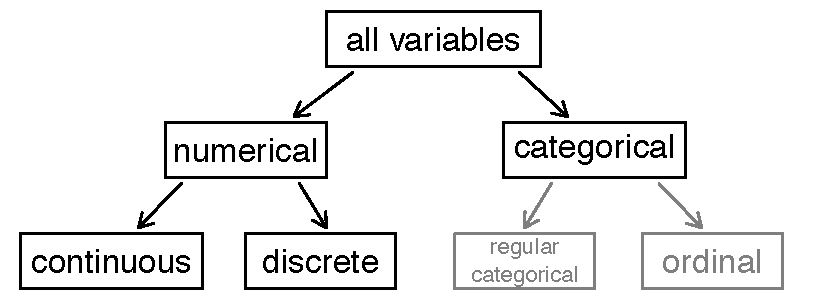
Diagram of types of variables we will analyze!
Your Turn (90-seconds)
Write down one example of:
a continuous, numerical variable
a discrete, numerical variable
an ordinal, categorical variable
a regular, categorical variable
Share with your neighbor!
Lab Warm-up
Data Types in R
Rows: 1,000
Columns: 10
$ fage           <int> 34, 36, 37, NA, 32, 32, 37, 29, 30, 29, 30, 34, 28, 28,…
$ mage           <dbl> 34, 31, 36, 16, 31, 26, 36, 24, 32, 26, 34, 27, 22, 31,…
$ weeks          <dbl> 37, 41, 37, 38, 36, 39, 36, 40, 39, 39, 42, 40, 40, 39,…
$ premie         <chr> "full term", "full term", "full term", "full term", "pr…
$ gained         <dbl> 28, 41, 28, 29, 48, 45, 20, 65, 25, 22, 40, 30, 31, NA,…
$ weight         <dbl> 6.96, 8.86, 7.51, 6.19, 6.75, 6.69, 6.13, 6.74, 8.94, 9…
$ lowbirthweight <chr> "not low", "not low", "not low", "not low", "not low", …
$ sex            <fct> male, female, female, male, female, female, female, mal…
$ habit          <chr> "nonsmoker", "nonsmoker", "nonsmoker", "nonsmoker", "no…
$ whitemom       <chr> "white", "white", "not white", "white", "white", "white…
What do you think dbl means?
How is that different from int?
What does chr mean?
How might it differ from fct?
Lab 1
Joining the STAT 313 Workspace on Posit Cloud
- Access Posit Cloud from link posted on Canvas
- Create a Cloud Student account (using your Cal Poly email)
$5 / month subscription
The Cloud Student account costs $5 / month. You will only need to pay for three (3) months of access, for a total of $15 for the quarter.
- Join the STAT 313 workspace
Accessing Lab 1
- Access Lab 1 either through:
- the link posted on Canvas
- the Content tab in the STAT 313 workspace
- Click on Lab 1 to open the Project
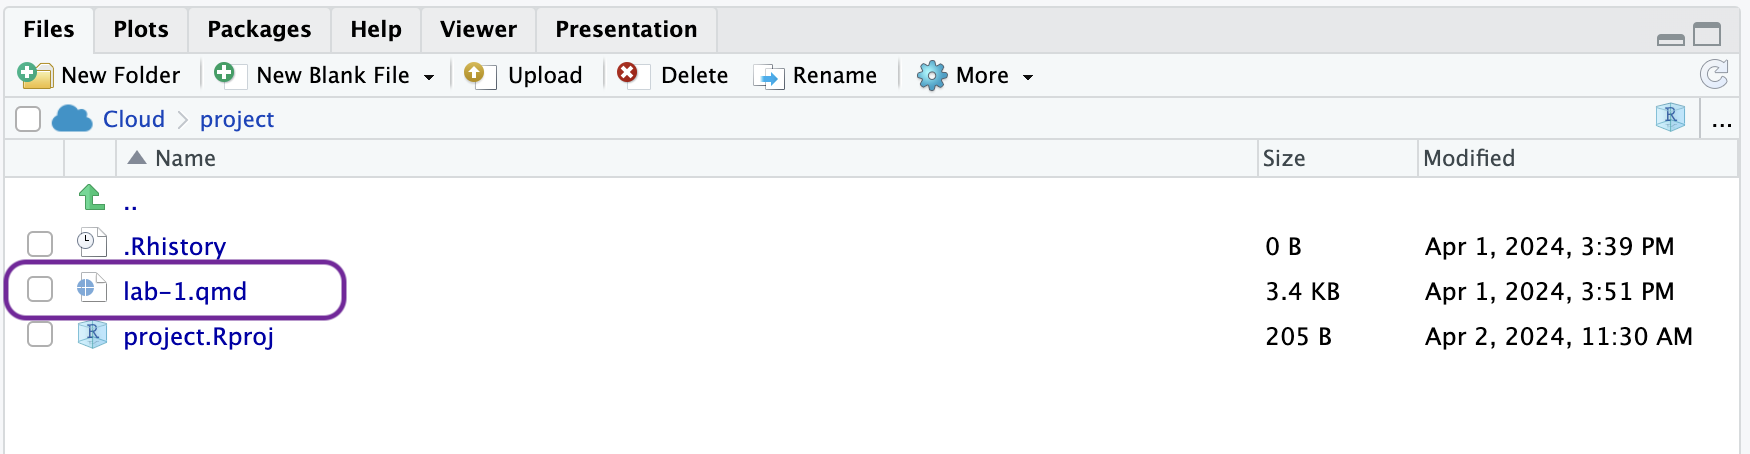
Opening the Lab 1 Document
- Click on the
lab-1.qmdfile in the lower right hand corner to open the lab assignment
- Start working!