rescale_01 <- function(vec) {

  if(!is.numeric(vec)) {
    stop("Input vector is not numeric")
  }

  if(length(vec) <= 1) {
    stop("Input vector length must have at least two elements")
  }

  range <- range(vec, na.rm = TRUE)

  return((vec - range[1]) / (range[2] - range[1]))
}Cool Plots & Searching for Efficiency
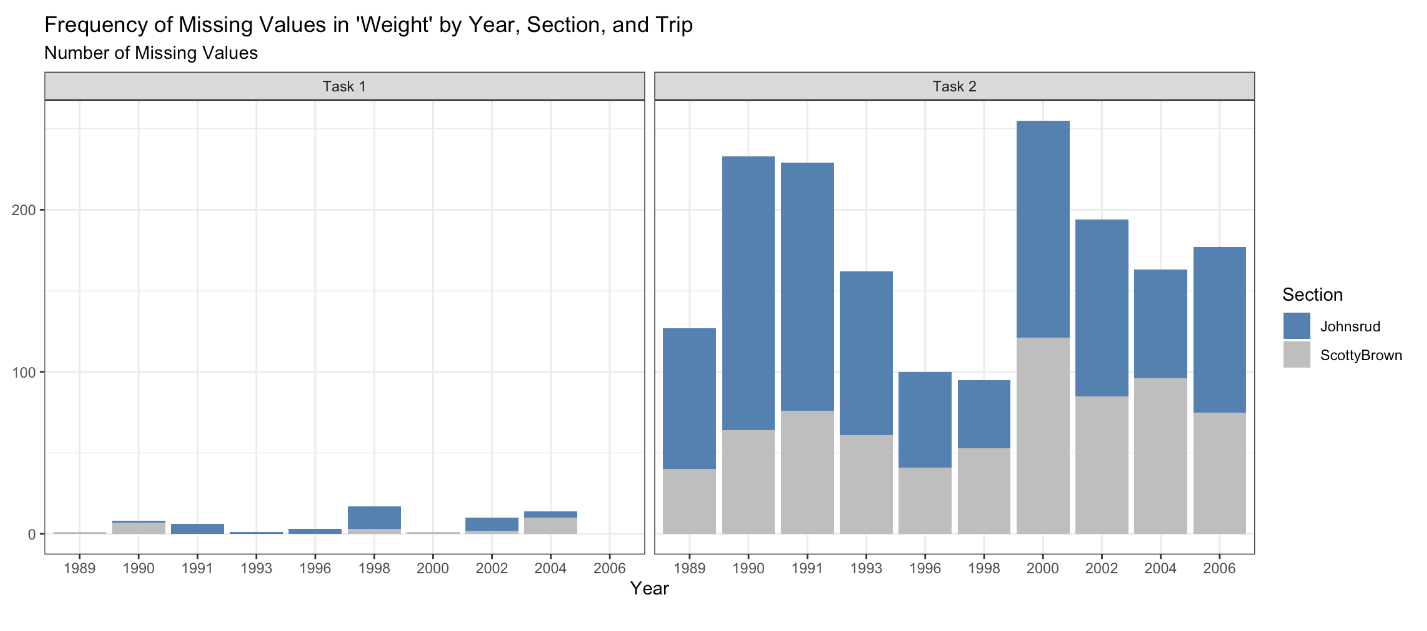
Stacked Bars with Color!

Notice how their facets have more informative titles?
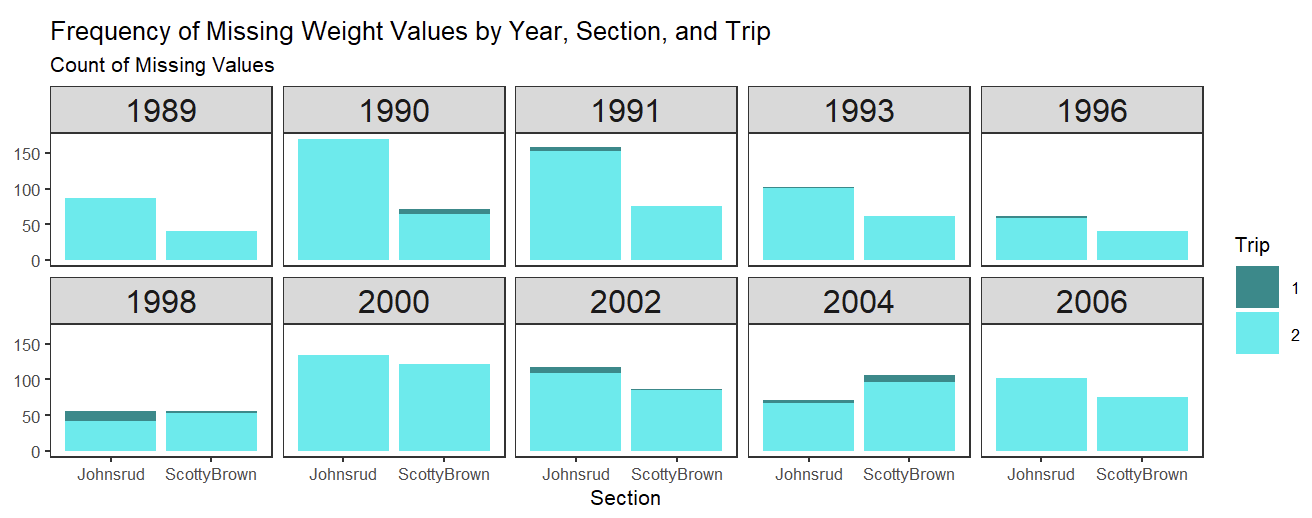
More Stacked Bars with Color!
Notice how every year with measurements is displayed?
Combining Year and Trip

Faceting by Year!
A Line Plot with Colors!
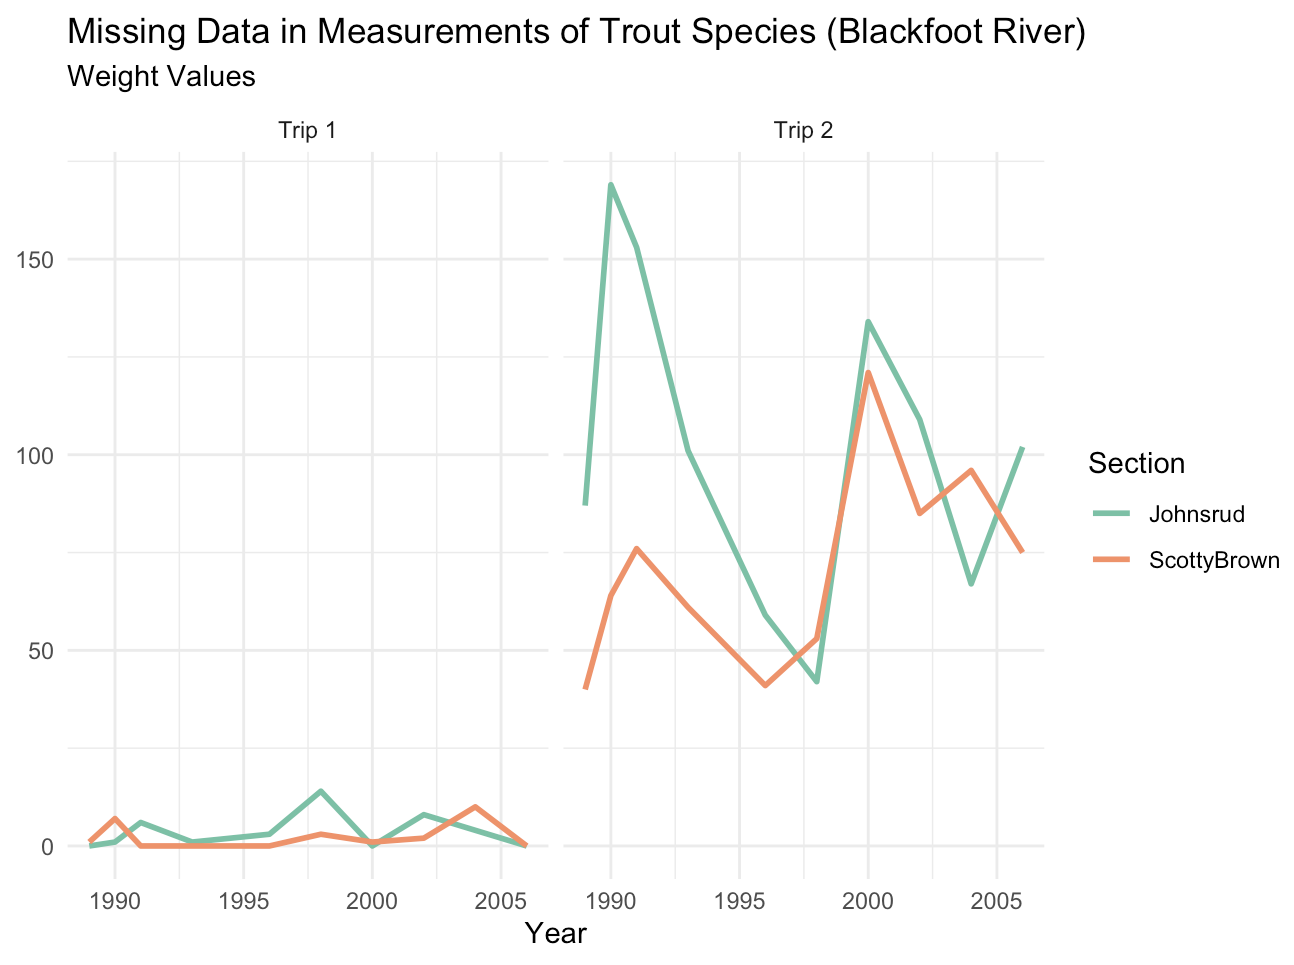
Do you want your legend on the left?
Code
fish |>
  group_by(year, section, trip) |>
  summarize(missing_count = sum(is.na(weight)), .groups = "drop") |>
  mutate(trip = case_when(
    trip == 1 ~ "Trip 1",
    trip == 2 ~ "Trip 2")) |>
  ggplot(aes(x = year, y = missing_count, color = section)) +
  geom_line(linewidth = 1) +
  scale_color_brewer(palette = "Set2") +
  labs(
    title = "Number of Missing Weight Measurements of Trout Species (Blackfoot River)",
    x = "",
    subtitle = "Across Sections of River and Trip Number",
    y = "",
    color = "Section") +
  facet_wrap(~ trip) +
  theme_minimal() +
  theme(legend.position = "top")
Could you remove your legend?
Code
plot <- fish |>
  group_by(year, section, trip) |>
  summarize(missing_count = sum(is.na(weight)), .groups = "drop") |>
  mutate(trip = case_when(
    trip == 1 ~ "Trip 1",
    trip == 2 ~ "Trip 2")) |>
  ggplot(aes(x = year, y = missing_count, color = section)) +
  geom_line(linewidth = 1) +
  scale_color_brewer(palette = "Set2") +
  labs(
    title = "Missing Fish Weights for Trout Species on the Blackfoot River",
    x = "Year",
    y = "",
    color = "Section") +
  facet_wrap(~ trip) +
  theme_minimal()


annotate_text <- data.frame(year = c(1994, 1993),
                            missing_count = c(150, 40),
                            trip = factor(c("Trip 2", "Trip 2"),
                                          levels = c("Trip 1","Trip 2"),
                                          ),
                            section = factor(c("Johnsrud", "ScottyBrown"),
                                             levels = c("Johnsrud", "ScottyBrown"))
                            )
plot +
  geom_text(data = annotate_text, label = c("Johnsrud", "ScottyBrown")) +
  theme(legend.position = "none",
        plot.title = element_text(size = 12),
        axis.text.x = element_text(size = 12),
        axis.text.y = element_text(size = 12),
        axis.title = element_text(size = 12),
        strip.text.x = element_text(size = 12)
        )
Could you remove your legend?
Code
library(ggtext)

fish |>
  group_by(year, section, trip) |>
  summarize(missing_count = sum(is.na(weight)), .groups = "drop") |>
  mutate(trip = case_when(
    trip == 1 ~ "Trip 1",
    trip == 2 ~ "Trip 2")) |>
  ggplot(aes(x = year, y = missing_count, color = section)) +
  geom_line(linewidth = 1) +
  scale_color_brewer(palette = "Set2") +
  labs(
    title = str_c("Missing Fish Weights for the ",
      "<span style = 'color:#66C2A5'>**Johnsrud**</span>",
      " and <span style = 'color:#FC8D62'>**ScottyBrown**</span>",
      " Sections of the Blackfoot River"),
    x = "Year",
    y = "",
    color = "Section") +
  facet_wrap(~ trip) +
  theme_minimal() +
  theme(plot.title = ggtext::element_markdown(size = 16),
        legend.position = "none",
        axis.text.x = element_text(size = 12),
        axis.text.y = element_text(size = 12),
        axis.title = element_text(size = 12),
        strip.text.x = element_text(size = 12)
        )
Other Cool Stuff People Have Done!