filter(.data = colleges, REGION == 5) |>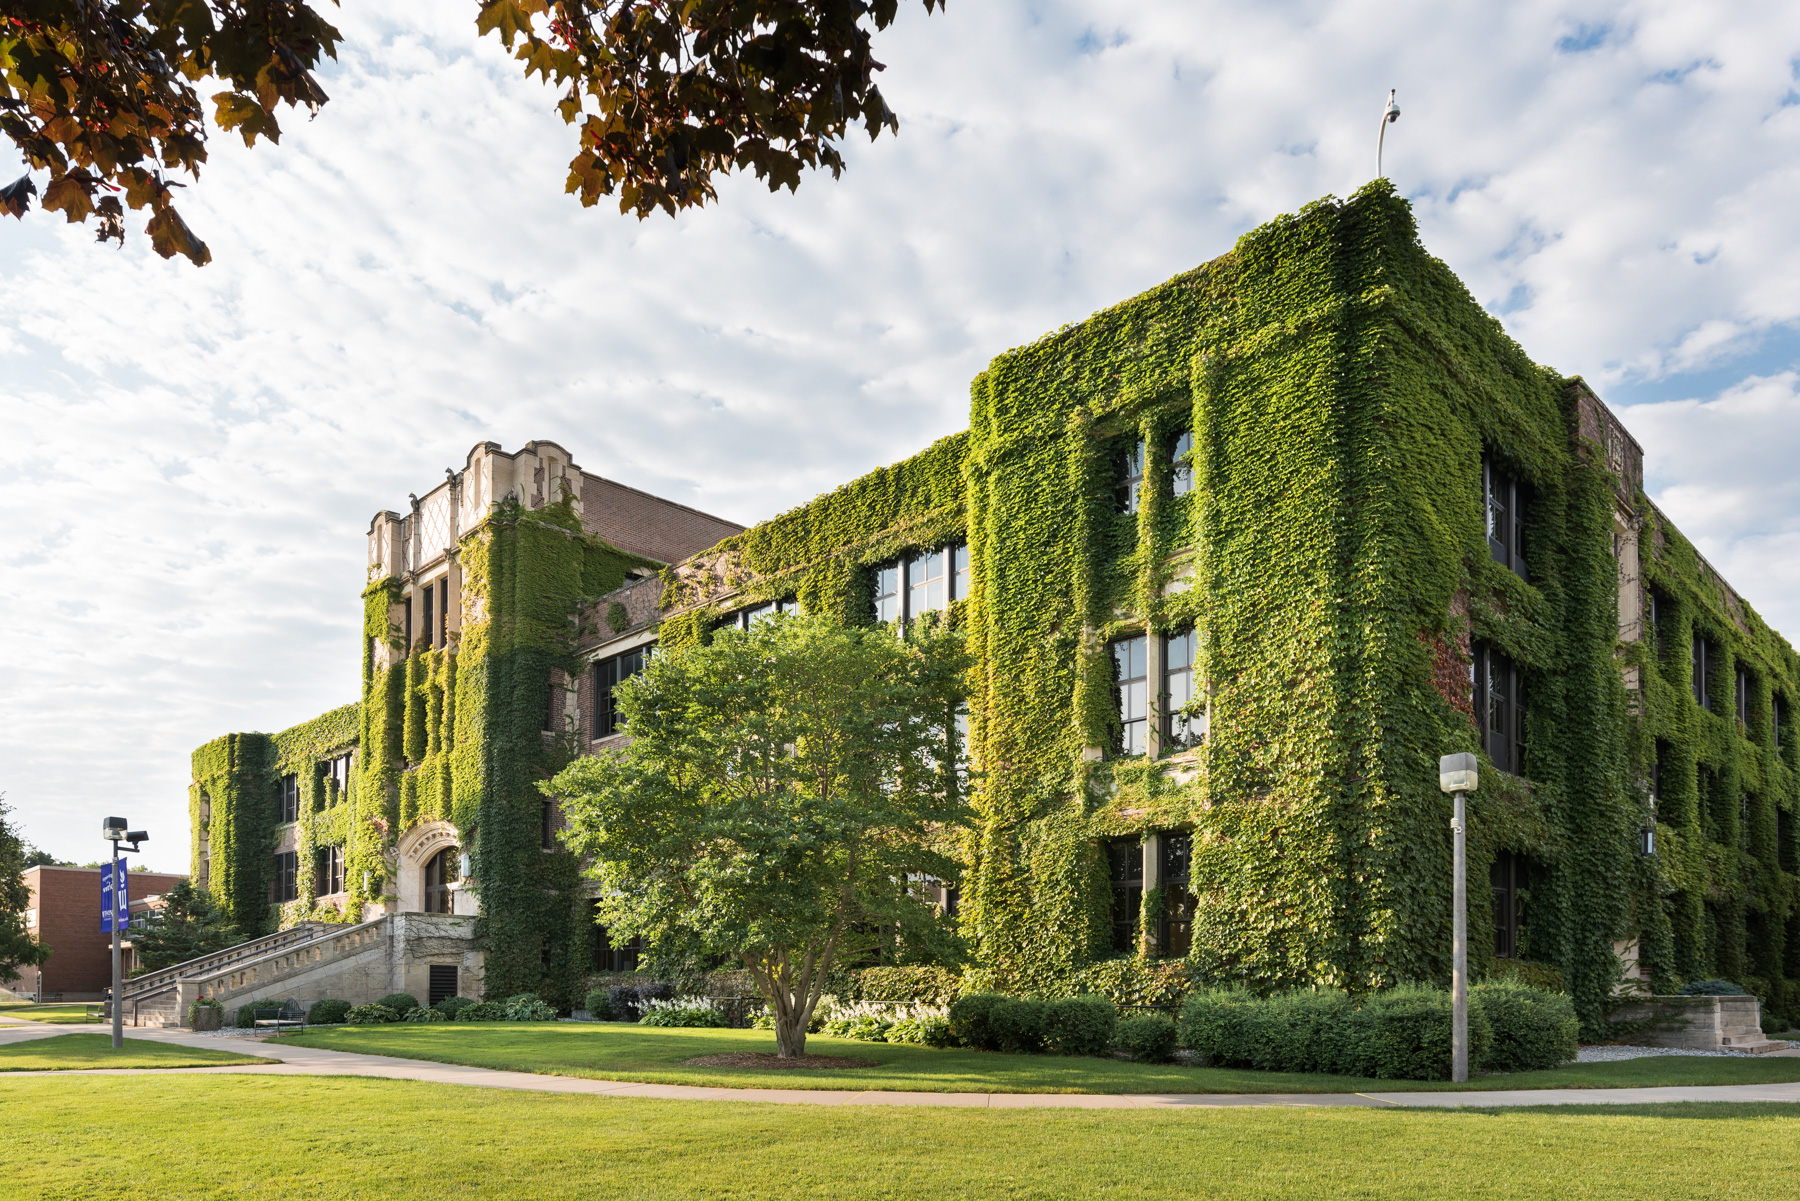
mutate(TUITION_DIFF = TUITIONFEE_OUT - TUITIONFEE_IN)Data Wrangling with dplyr
Data Wrangling with dplyr
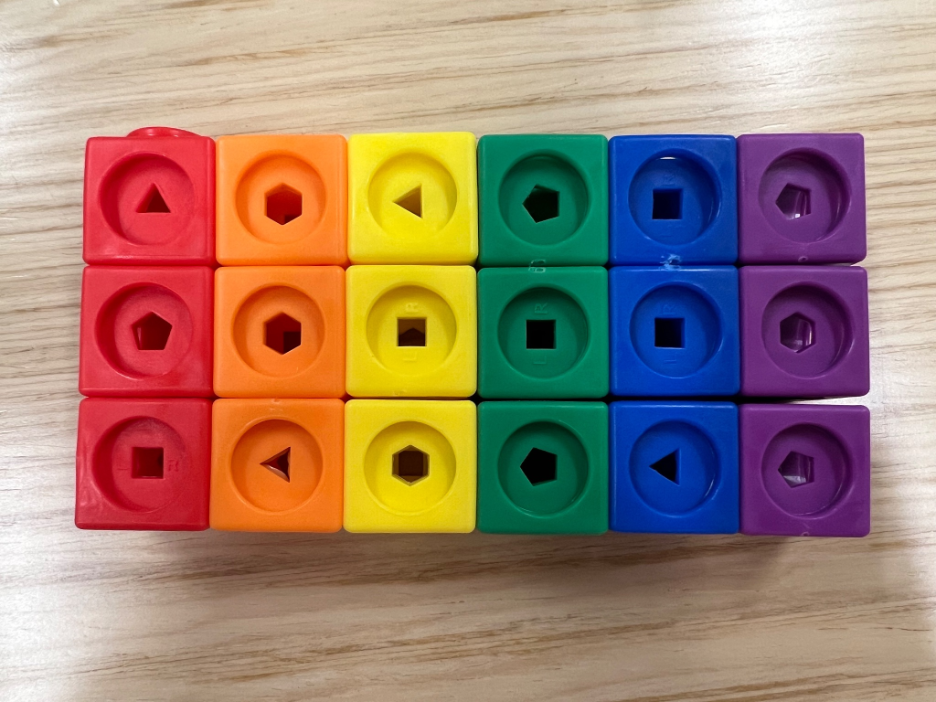
Data Frame
Data Frame
How many rows?
Data Frame
How many columns?
Observations
Here is one observation:
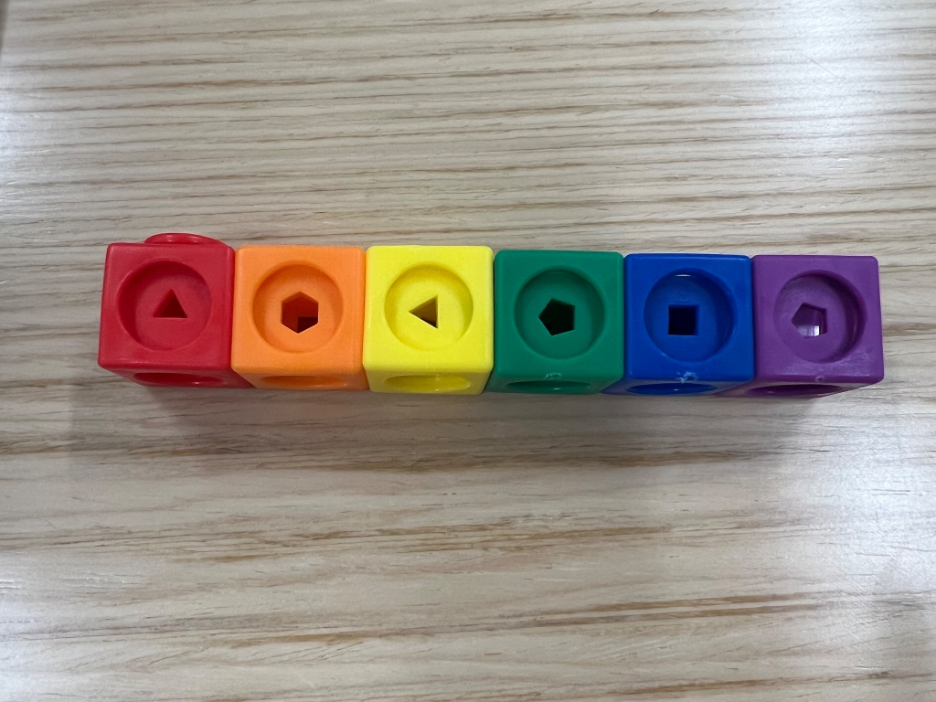
Looking at the column green, how many sides does the observation have?
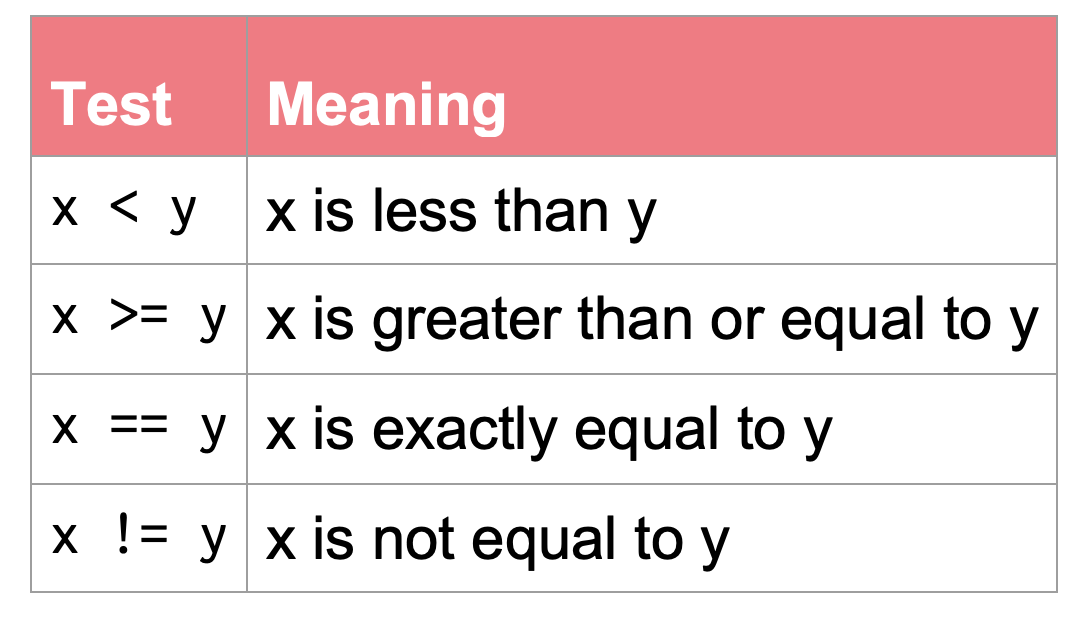
How would we write this as R code?
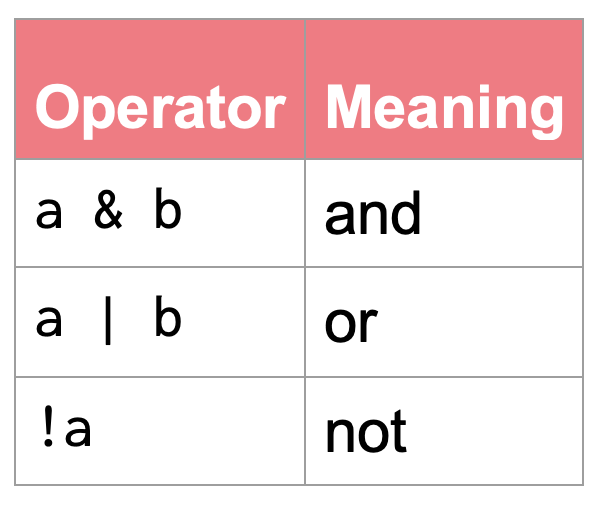
the red column only includes observations with three sides (triangles) OR the green column only includes observations with more than four sides (pentagons, hexagons)
PA 3: Identify the Mystery College
Today you will use the dplyr package to clean some data and then use that cleaned data to figure out what college Ephelia has been accepted to.
Finding Ephelia’s College
This activity will require knowledge of:
- debugging code errors
- function syntax
- logical comparisons
- identifying what actions need to be taken
- locating what dplyr verb(s) can accomplish this task
- chaining steps together with the pipe operator
![This image is a comic illustration titled 'debugging' featuring a series of 10 round green characters with various facial expressions and captions describing the stages of debugging code. The first character is smiling confidently with the caption 'I got this.' The second character has a neutral, confused expression with the caption 'Huh. Really thought that was it.' The third character looks puzzled and silent, captioned '(...).' The fourth character looks annoyed, with the caption 'Fine. Restarting.' The fifth character is angry and blushing, captioned 'OH WTF.' The sixth character is having a meltdown, looking wild-eyed and frazzled with the caption 'Zombie meltdown.' The seventh character looks exhausted and sleepy, drooling a bit, captioned with '...' The eighth character has a lightbulb above its head and a hopeful expression, captioned 'A NEW HOPE!' The ninth character looks determined, typing on a keyboard with a caption of '[insert awesome theme song].' Finally, the tenth character is joyful and celebrating with confetti, captioned 'I love CODING' The illustration humorously captures the emotional rollercoaster of debugging code.](images/debugging_horst.png)
None of us have all these abilities. Each of us has some of these abilities.
dplyr Resources
Every of you should have a dplyr cheatsheet!
On the Front
- Column 1: grouped summaries (
group_by()+summarize()) - Column 2:
filter()ing values with logical comparisons - Column 3:
select()ing andmutate()ing variables
On the Back
- Column 2: summary functions you might like to use with
summarize()
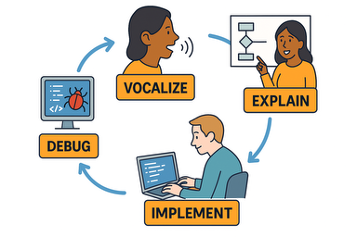
Pair Programming Expectations
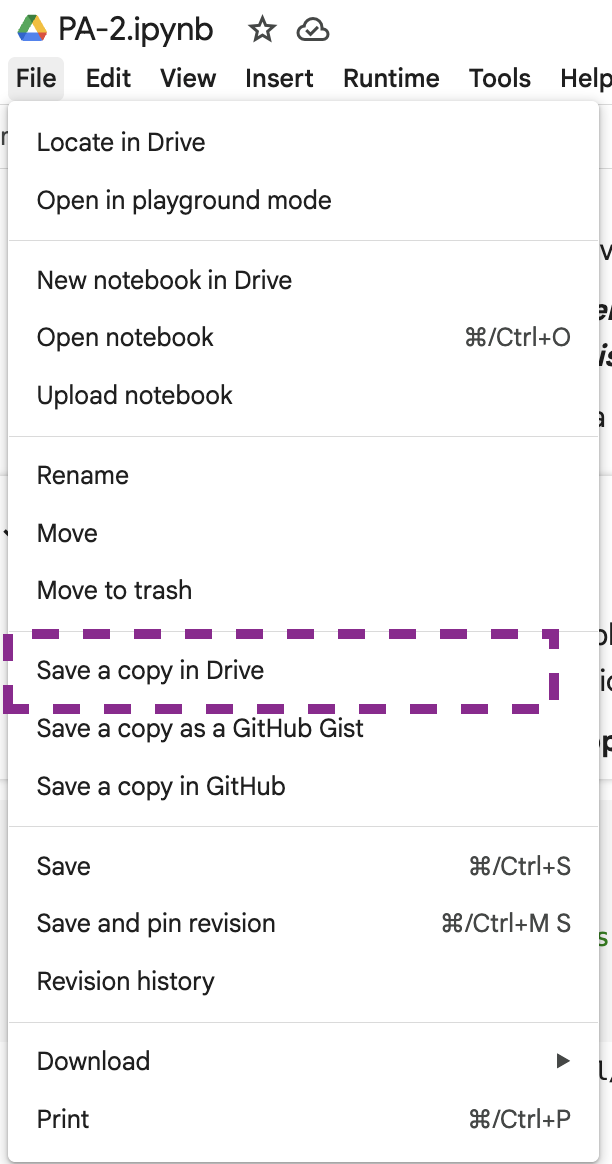
Opening the Practice Activity in Google Colab
The Computer needs to:
- Click on the Practice Activity 3 link from Canvas
- Log-in to your Google account
- Make a copy of the Colab notebook
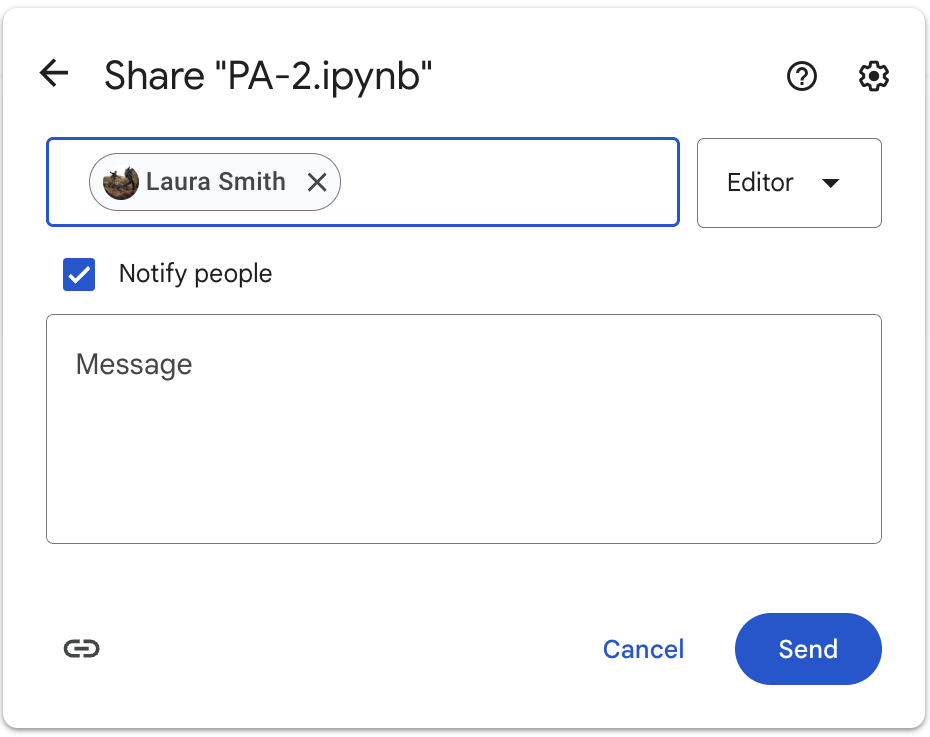
Sharing with Your Partner
Once you have your copy, you need to:
- Share your copy with your partner’s Google account
- Make sure the Coder can open the file
- The Computer should plug their laptop into the monitor
- The Coder should close their computer
- Get started!
Team Assignments - 9am
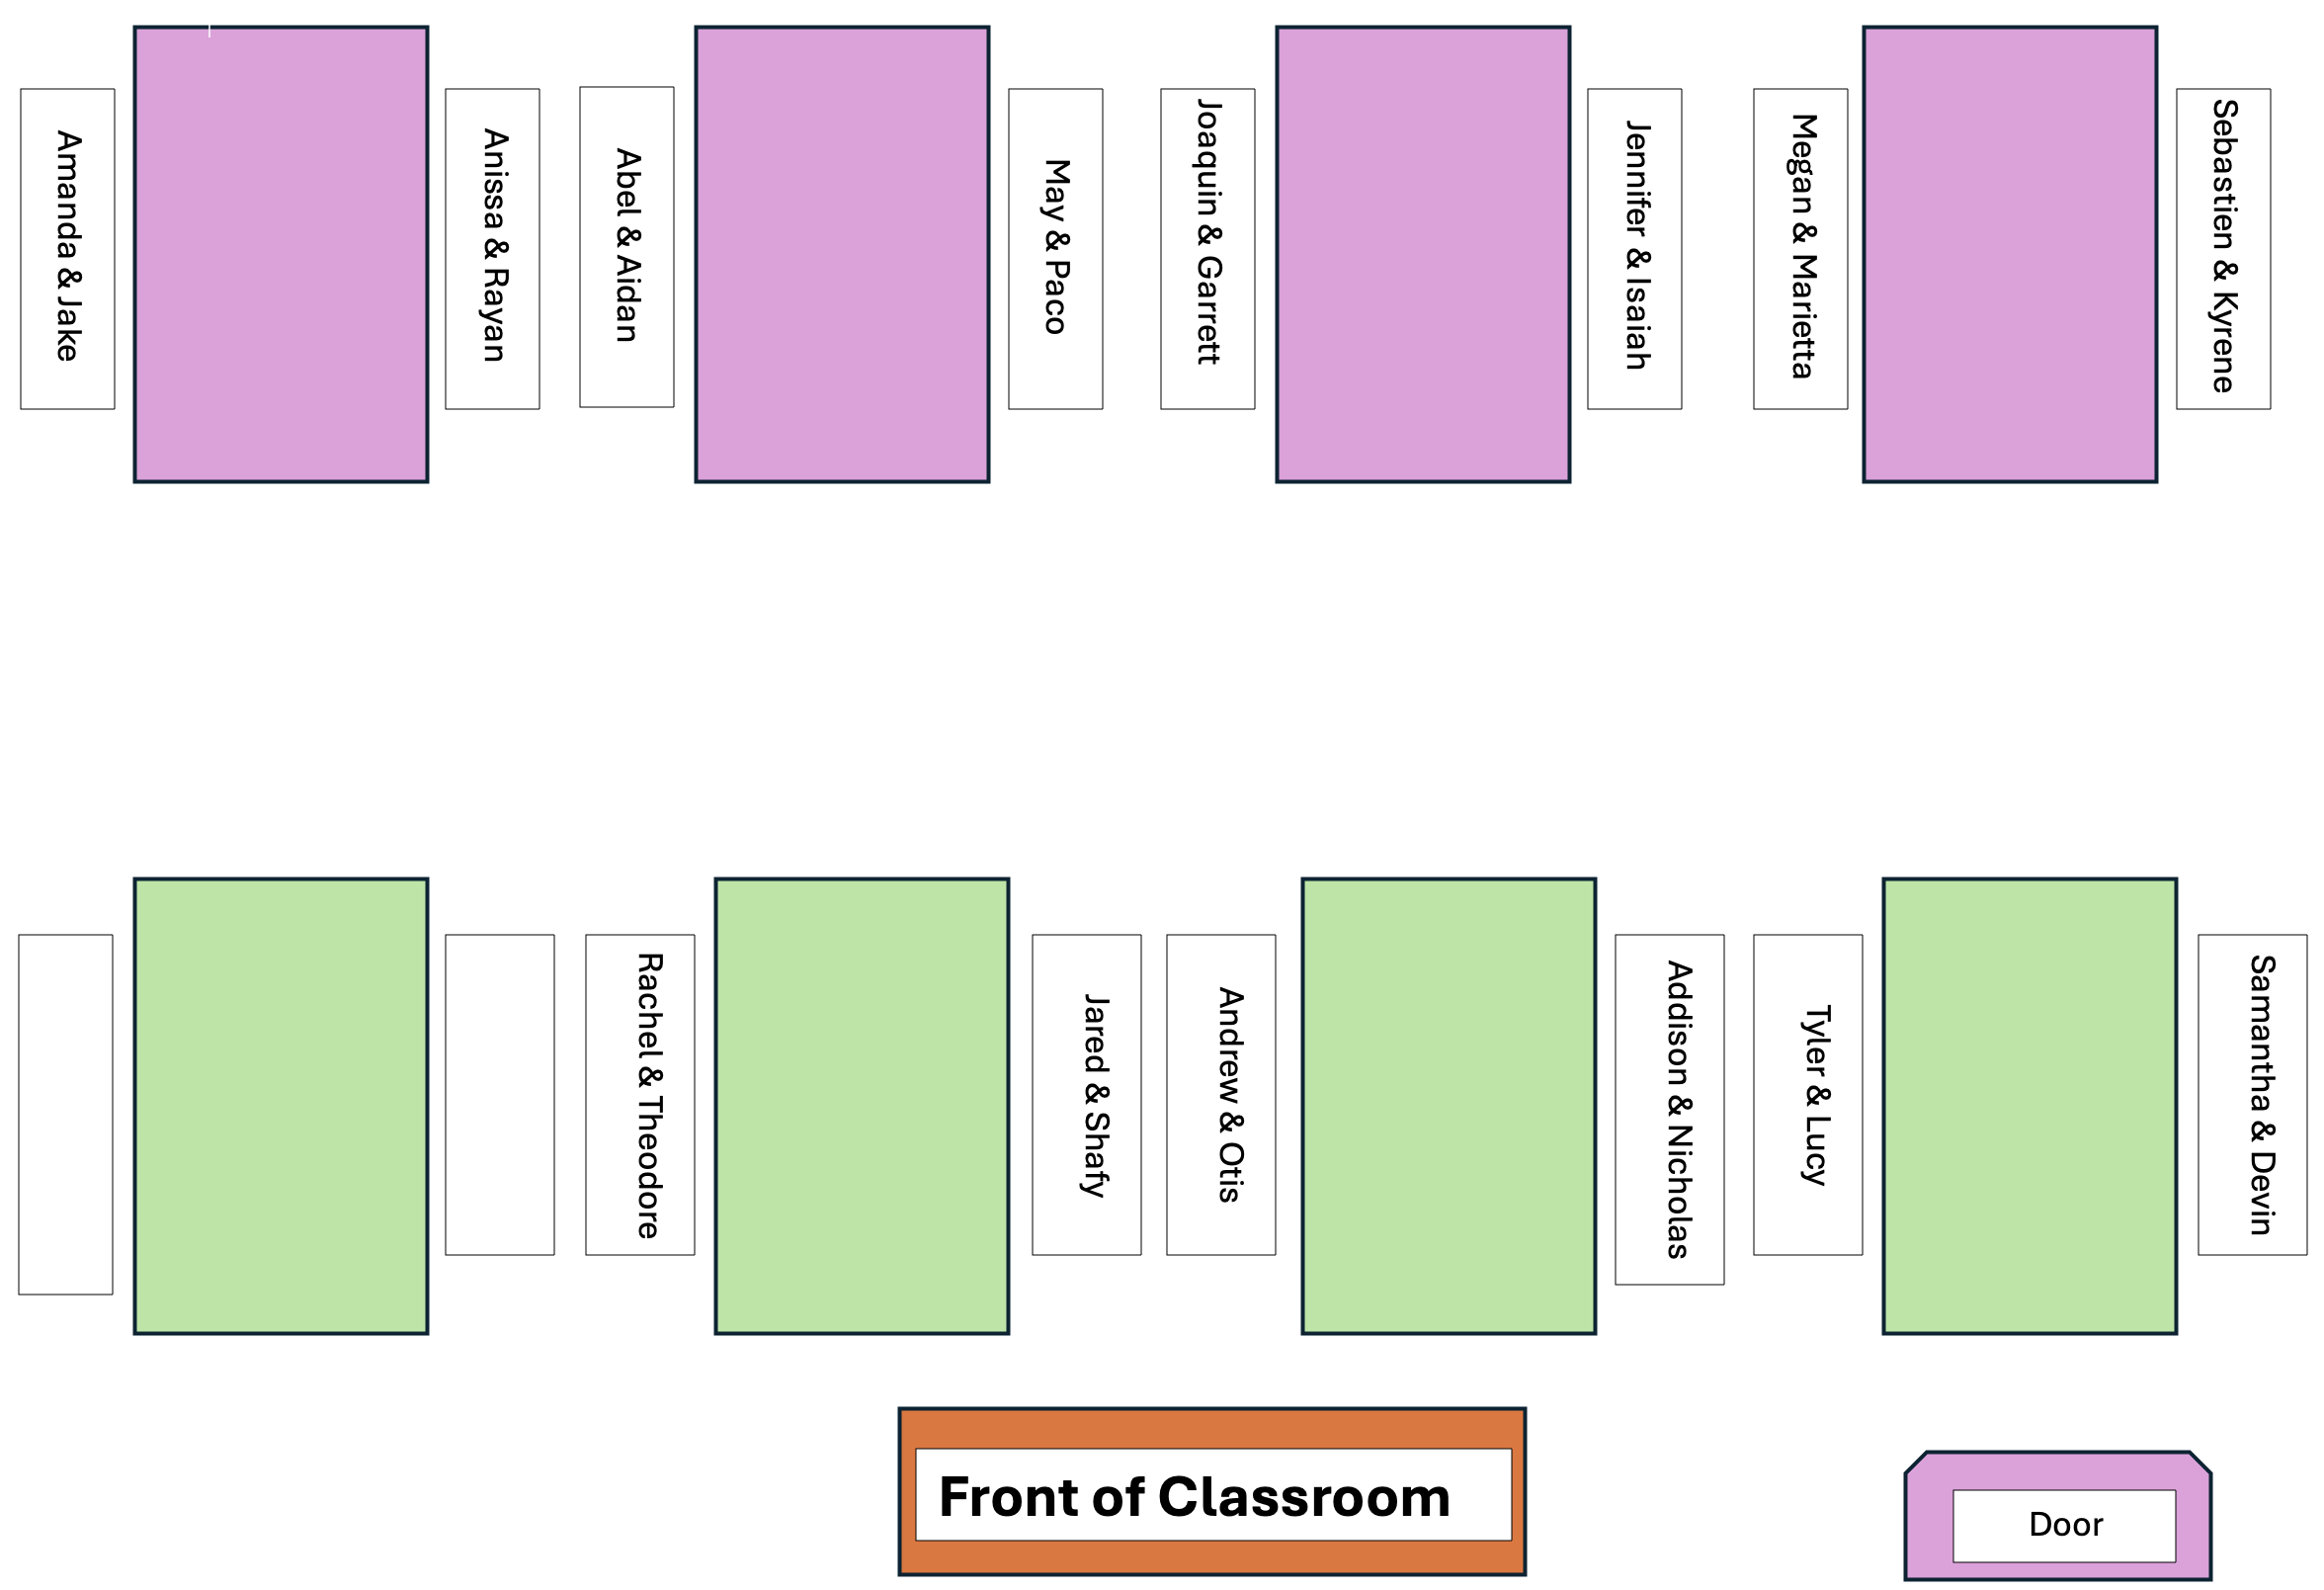
The partner whose birthday is closest to January 1st starts as the Computer, making a copy of the PA Colab notebook!
Team Assignments - 12pm
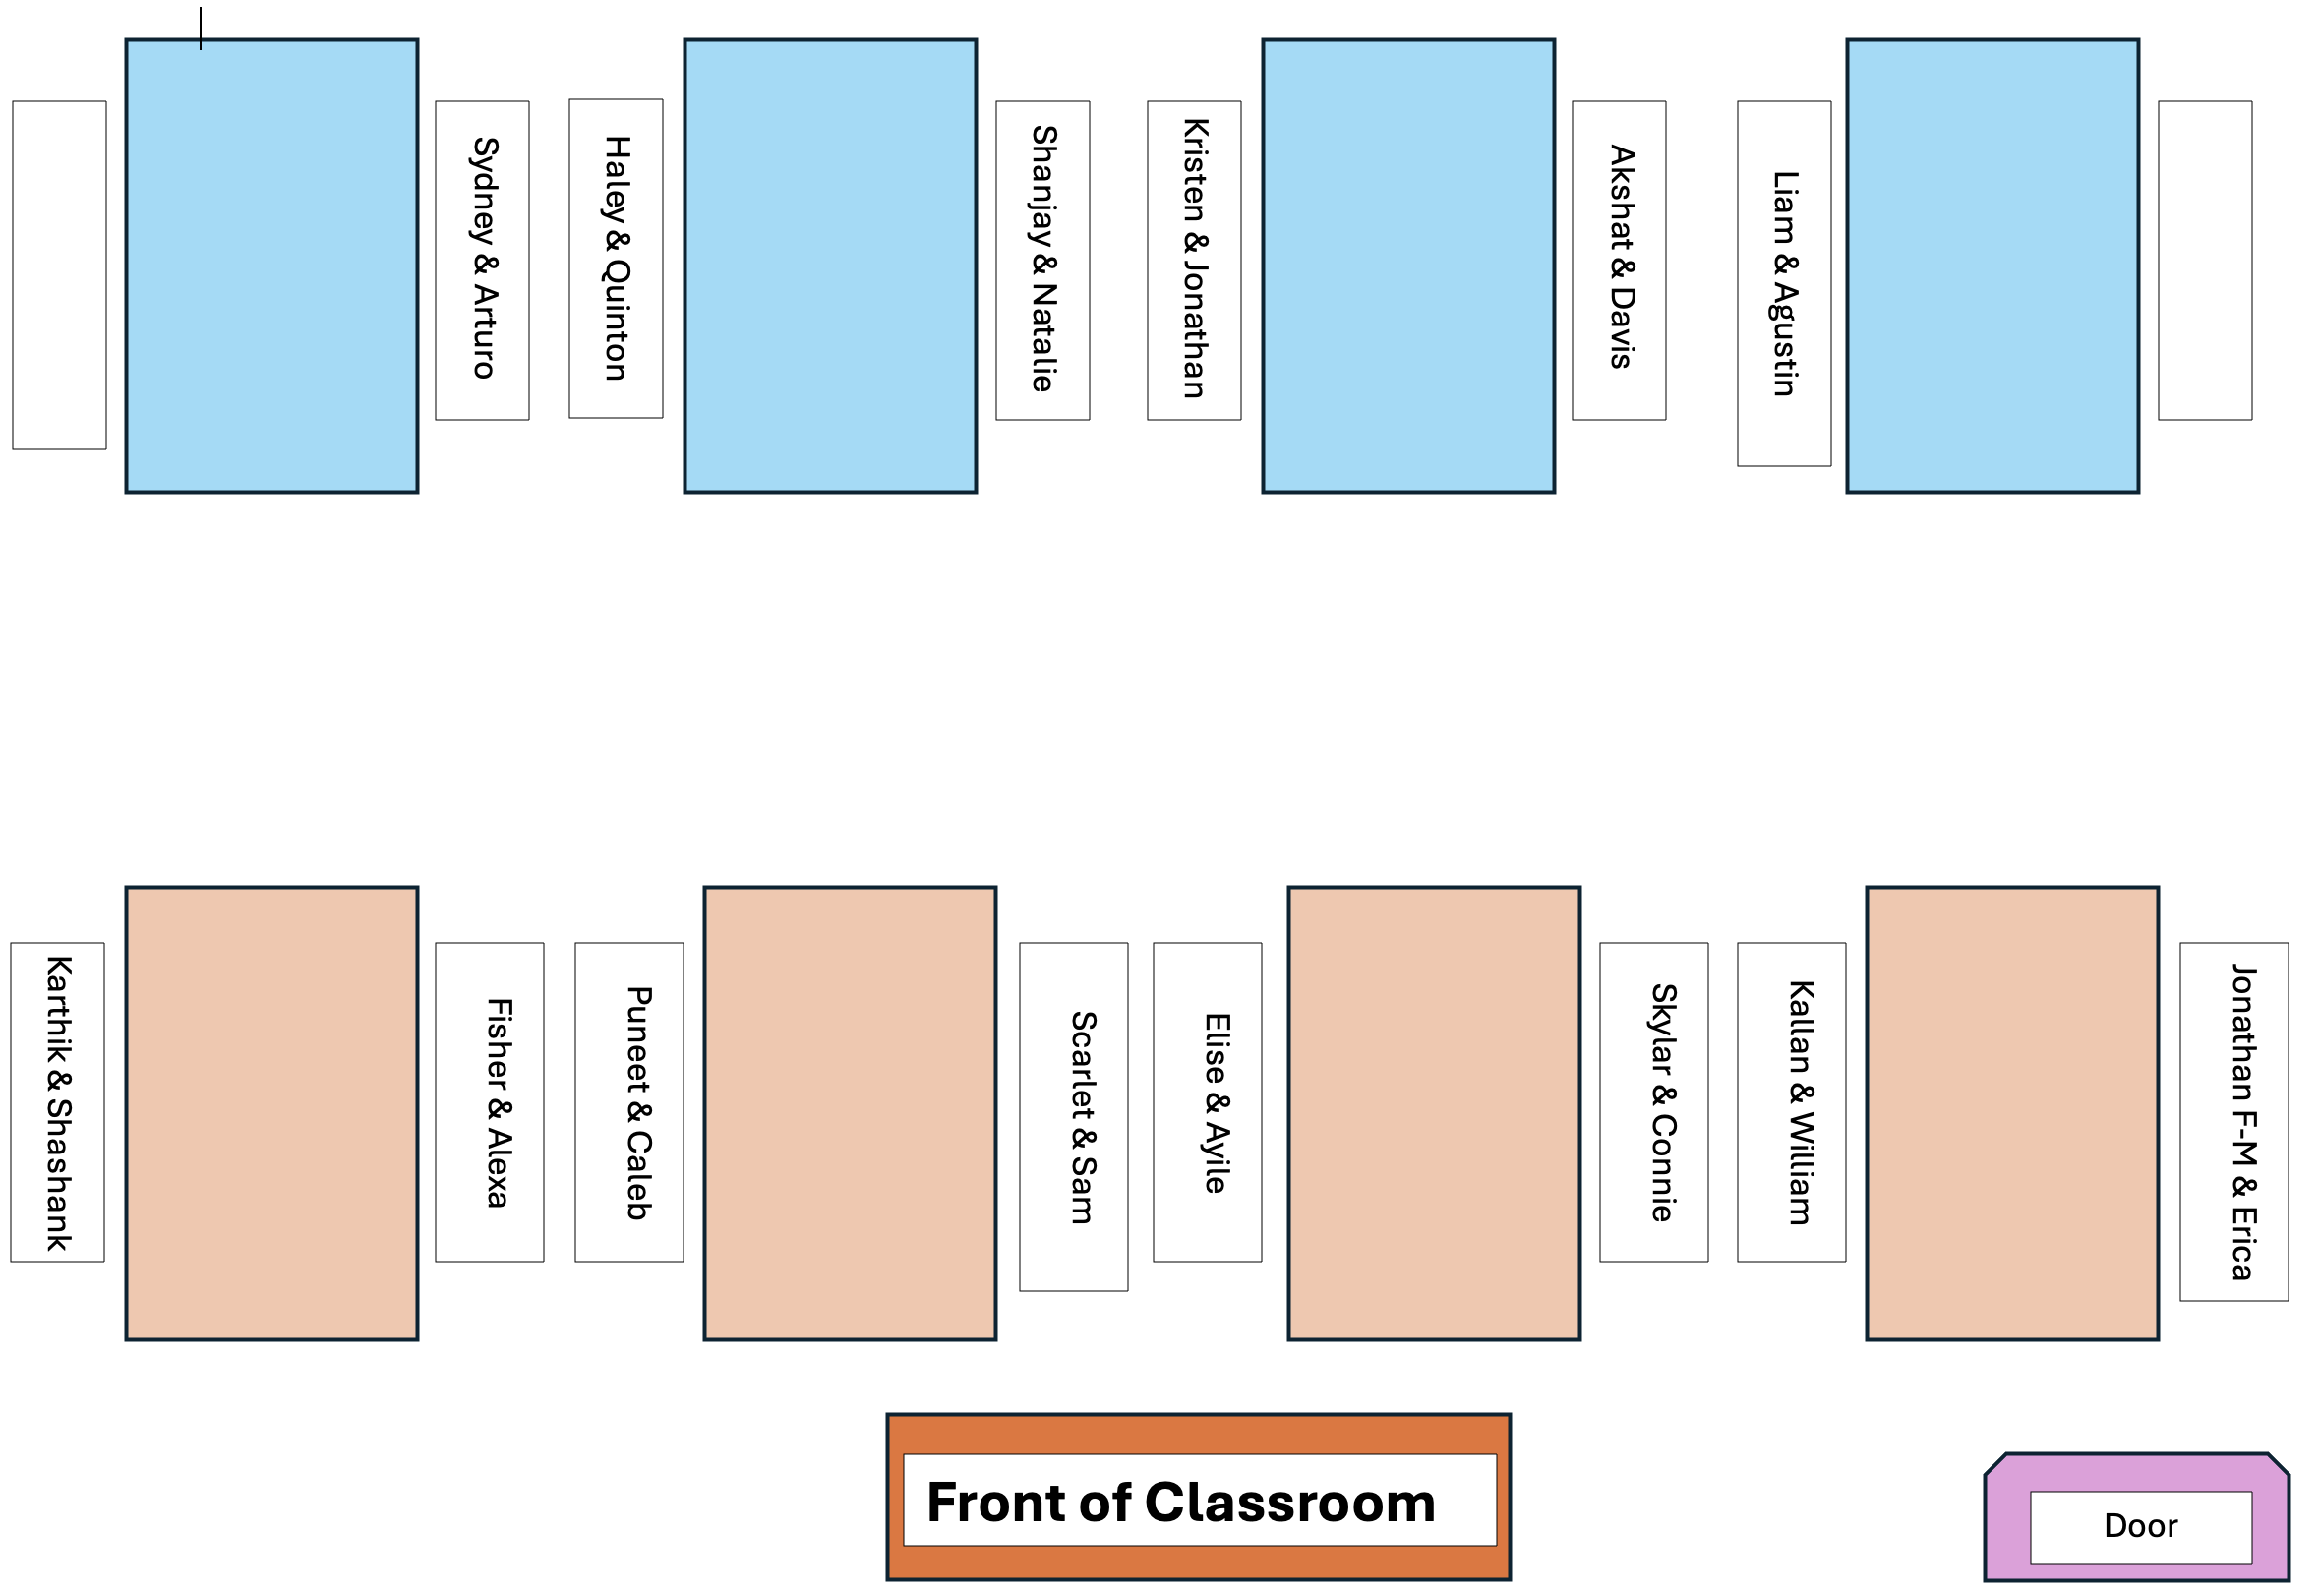
The partner whose birthday is closest to January 1st starts as the Computer, making a copy of the PA Colab notebook!