library(palmerpenguins)

?penguinsBasics of Graphics
Data Context for Today

What do you notice about these data?
ggplot(data = penguins)What do you expect to see after running this code?

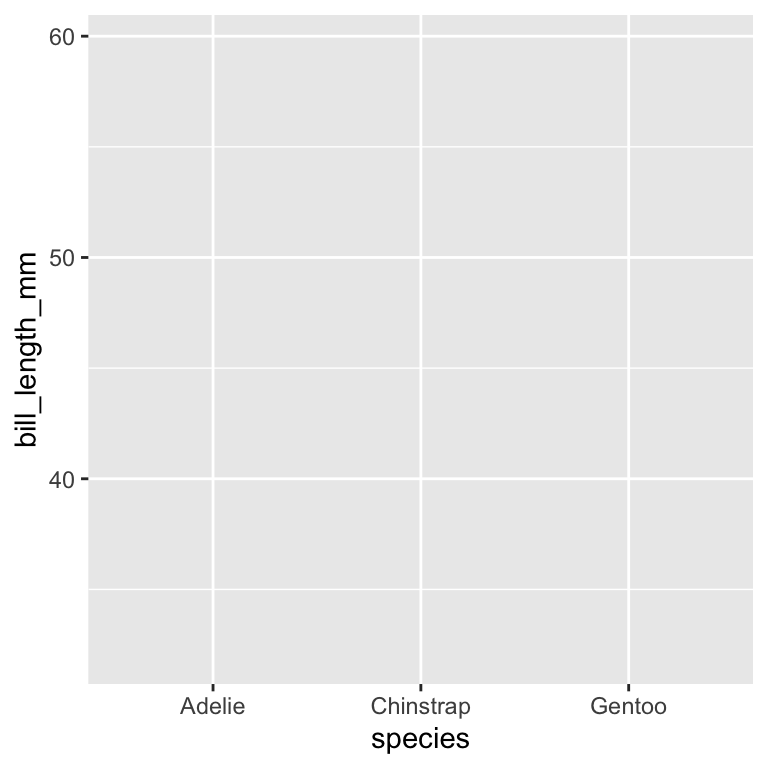
ggplot(data = penguins,
       mapping = aes(x = species, y = bill_length_mm)
       )
What do you expect to see after running this code?
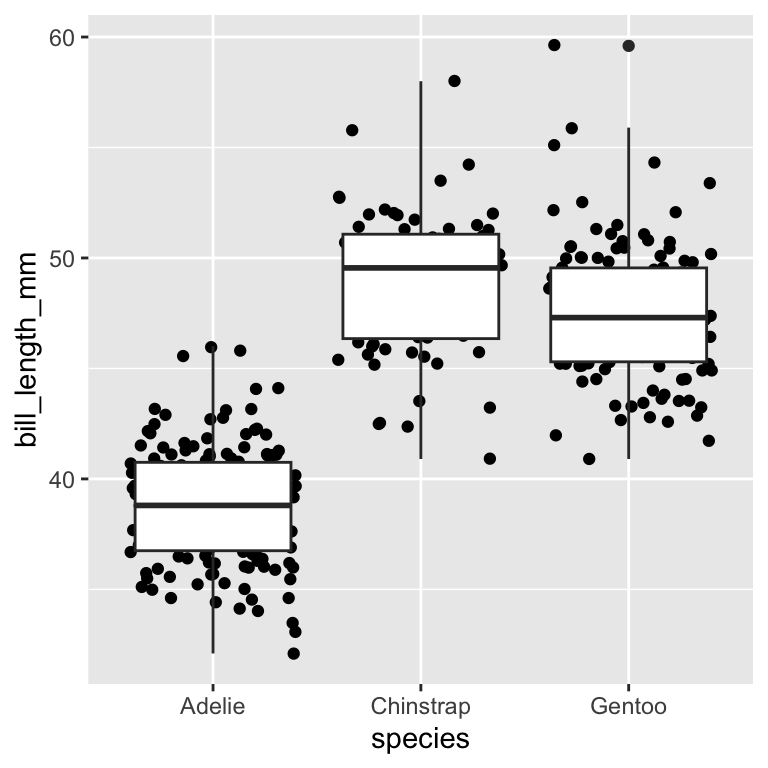
ggplot(data = penguins,
       mapping = aes(x = species, y = bill_length_mm)
       ) +
  geom_jitter() +
  geom_boxplot()
What do you expect to see after running this code?
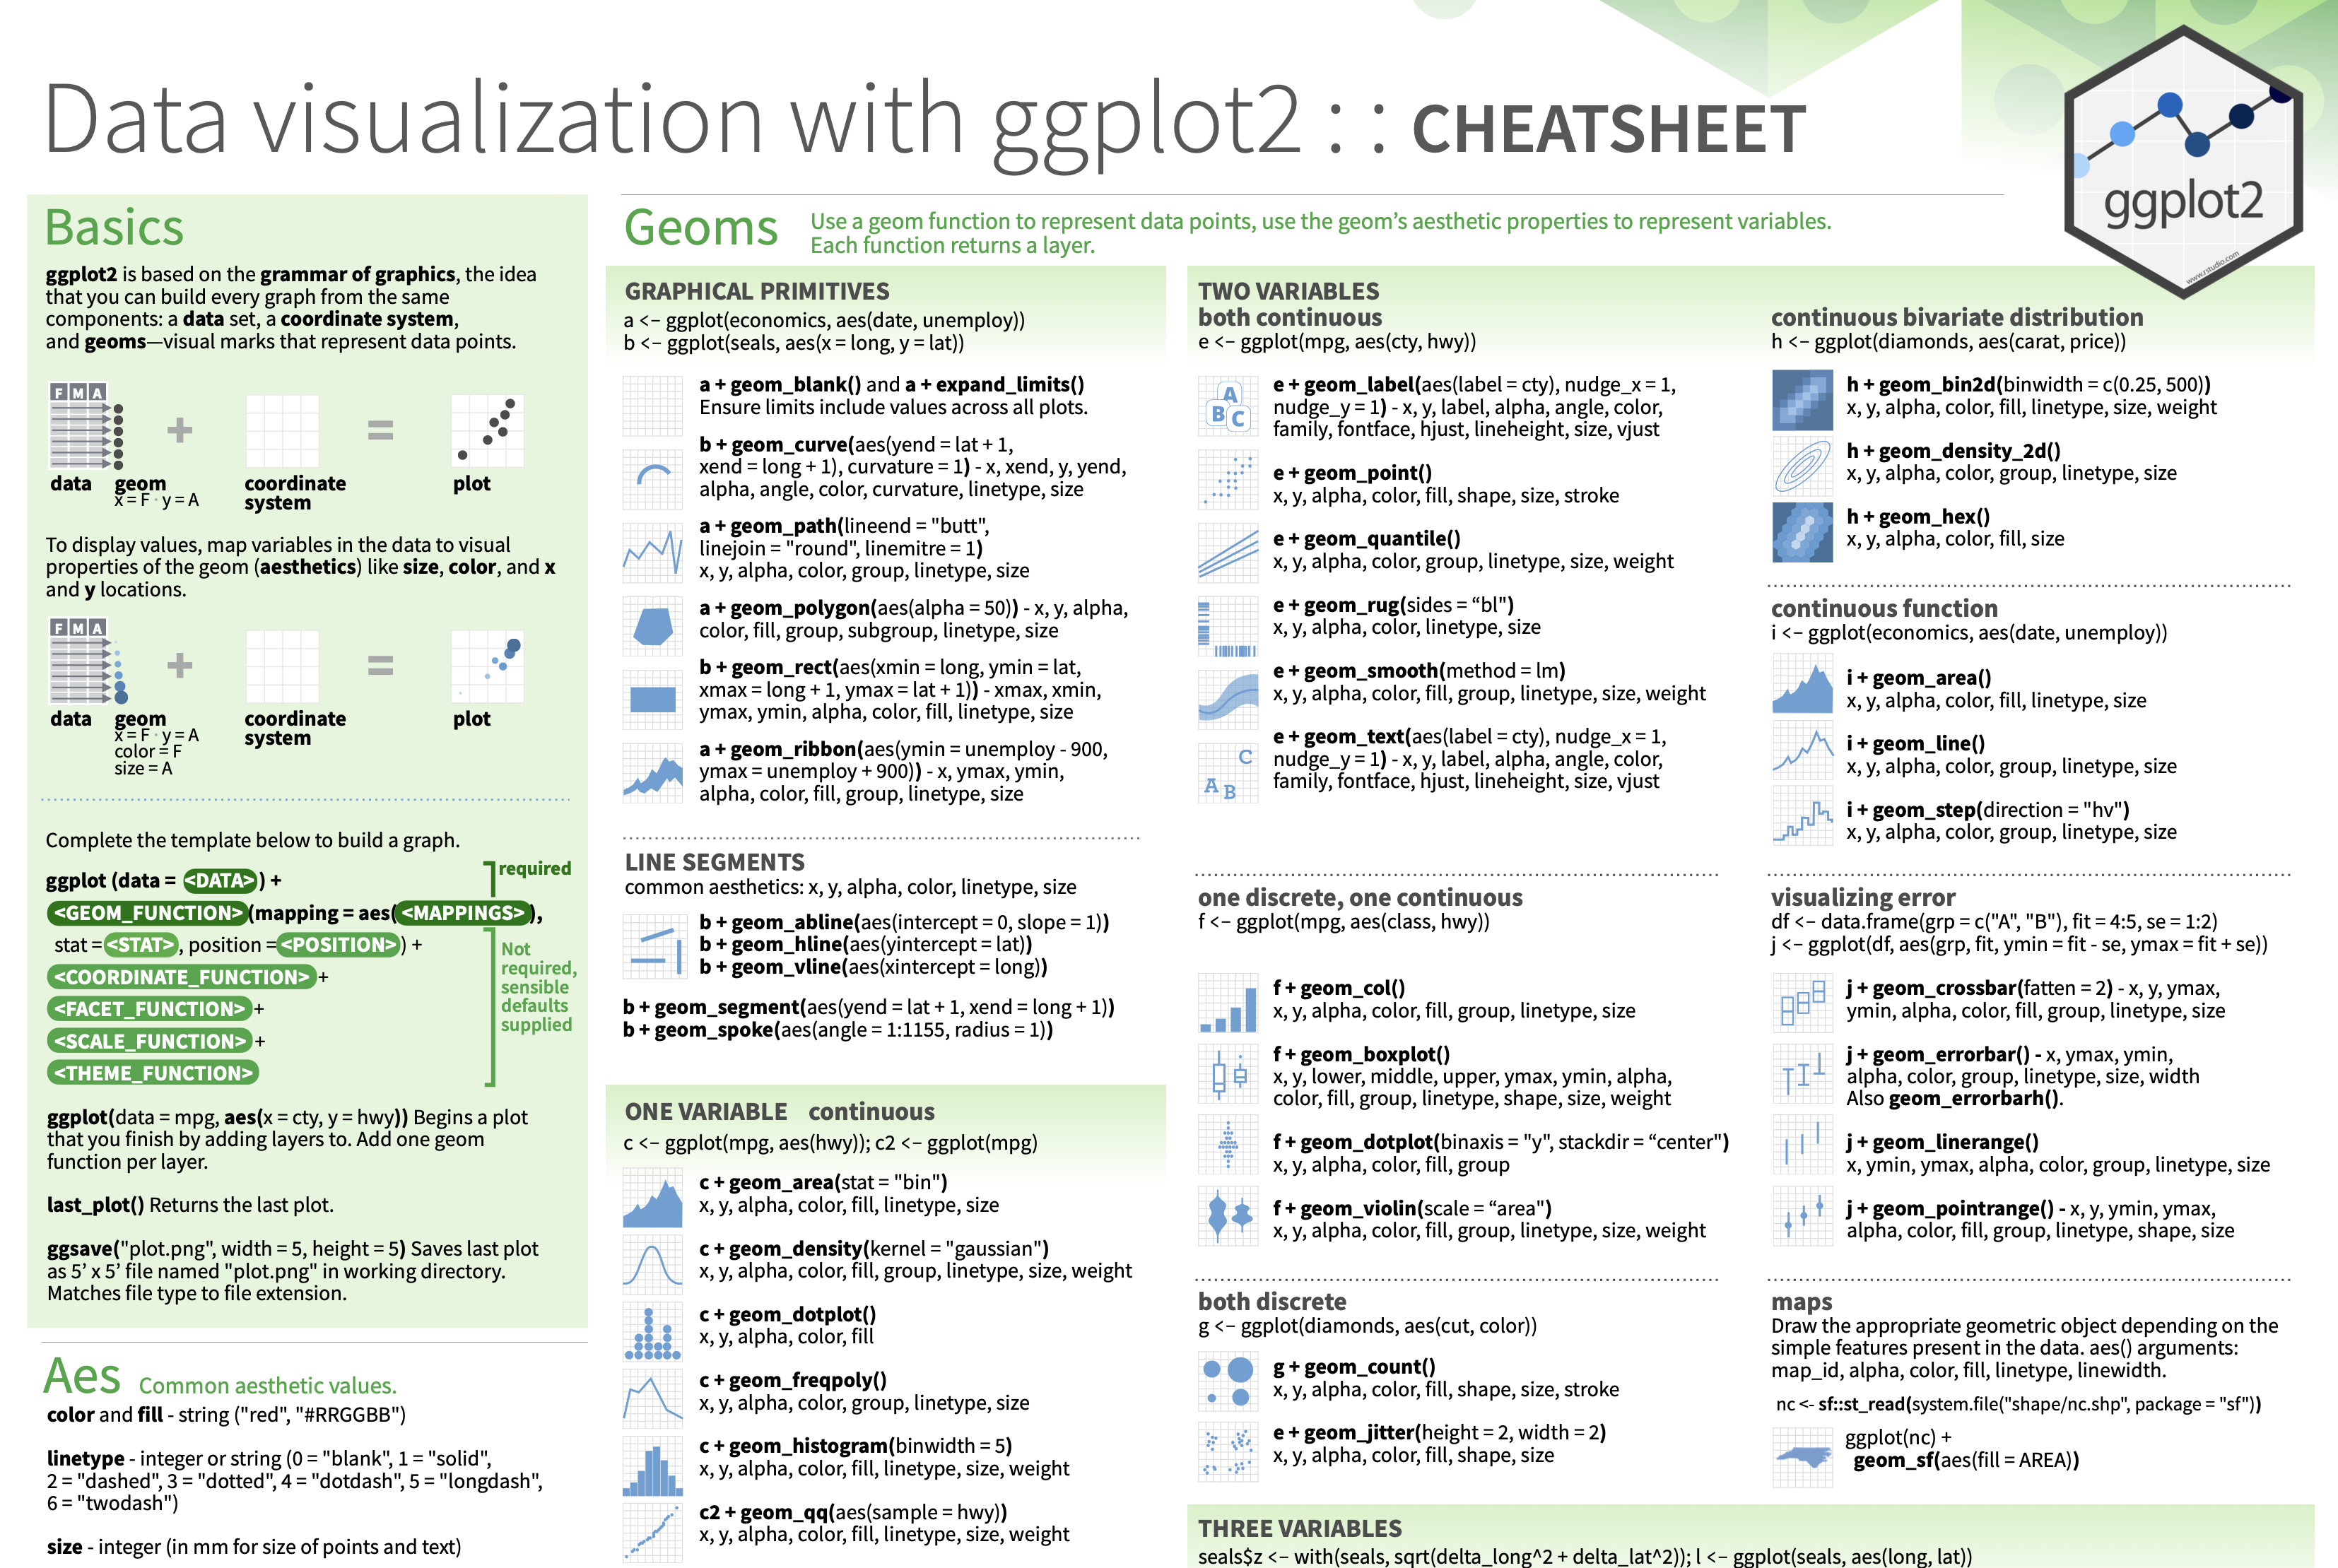
ggplot2 Resources
Every person should have a ggplot2 cheatsheet!
On the Front
- Column 1: the “template” for making a ggplot
- Column 2: creating plots for one continuous or one discrete variable
- Column 3: creating plots for two continuous variables
On the Back
- Column 4: adding facets and labels to your plot
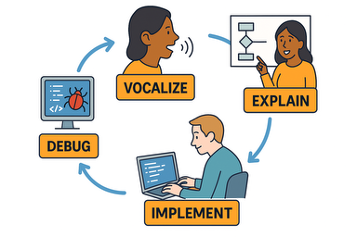
PA 2: Using Data Visualization to Find the Penguins

Artwork by Allison Horst
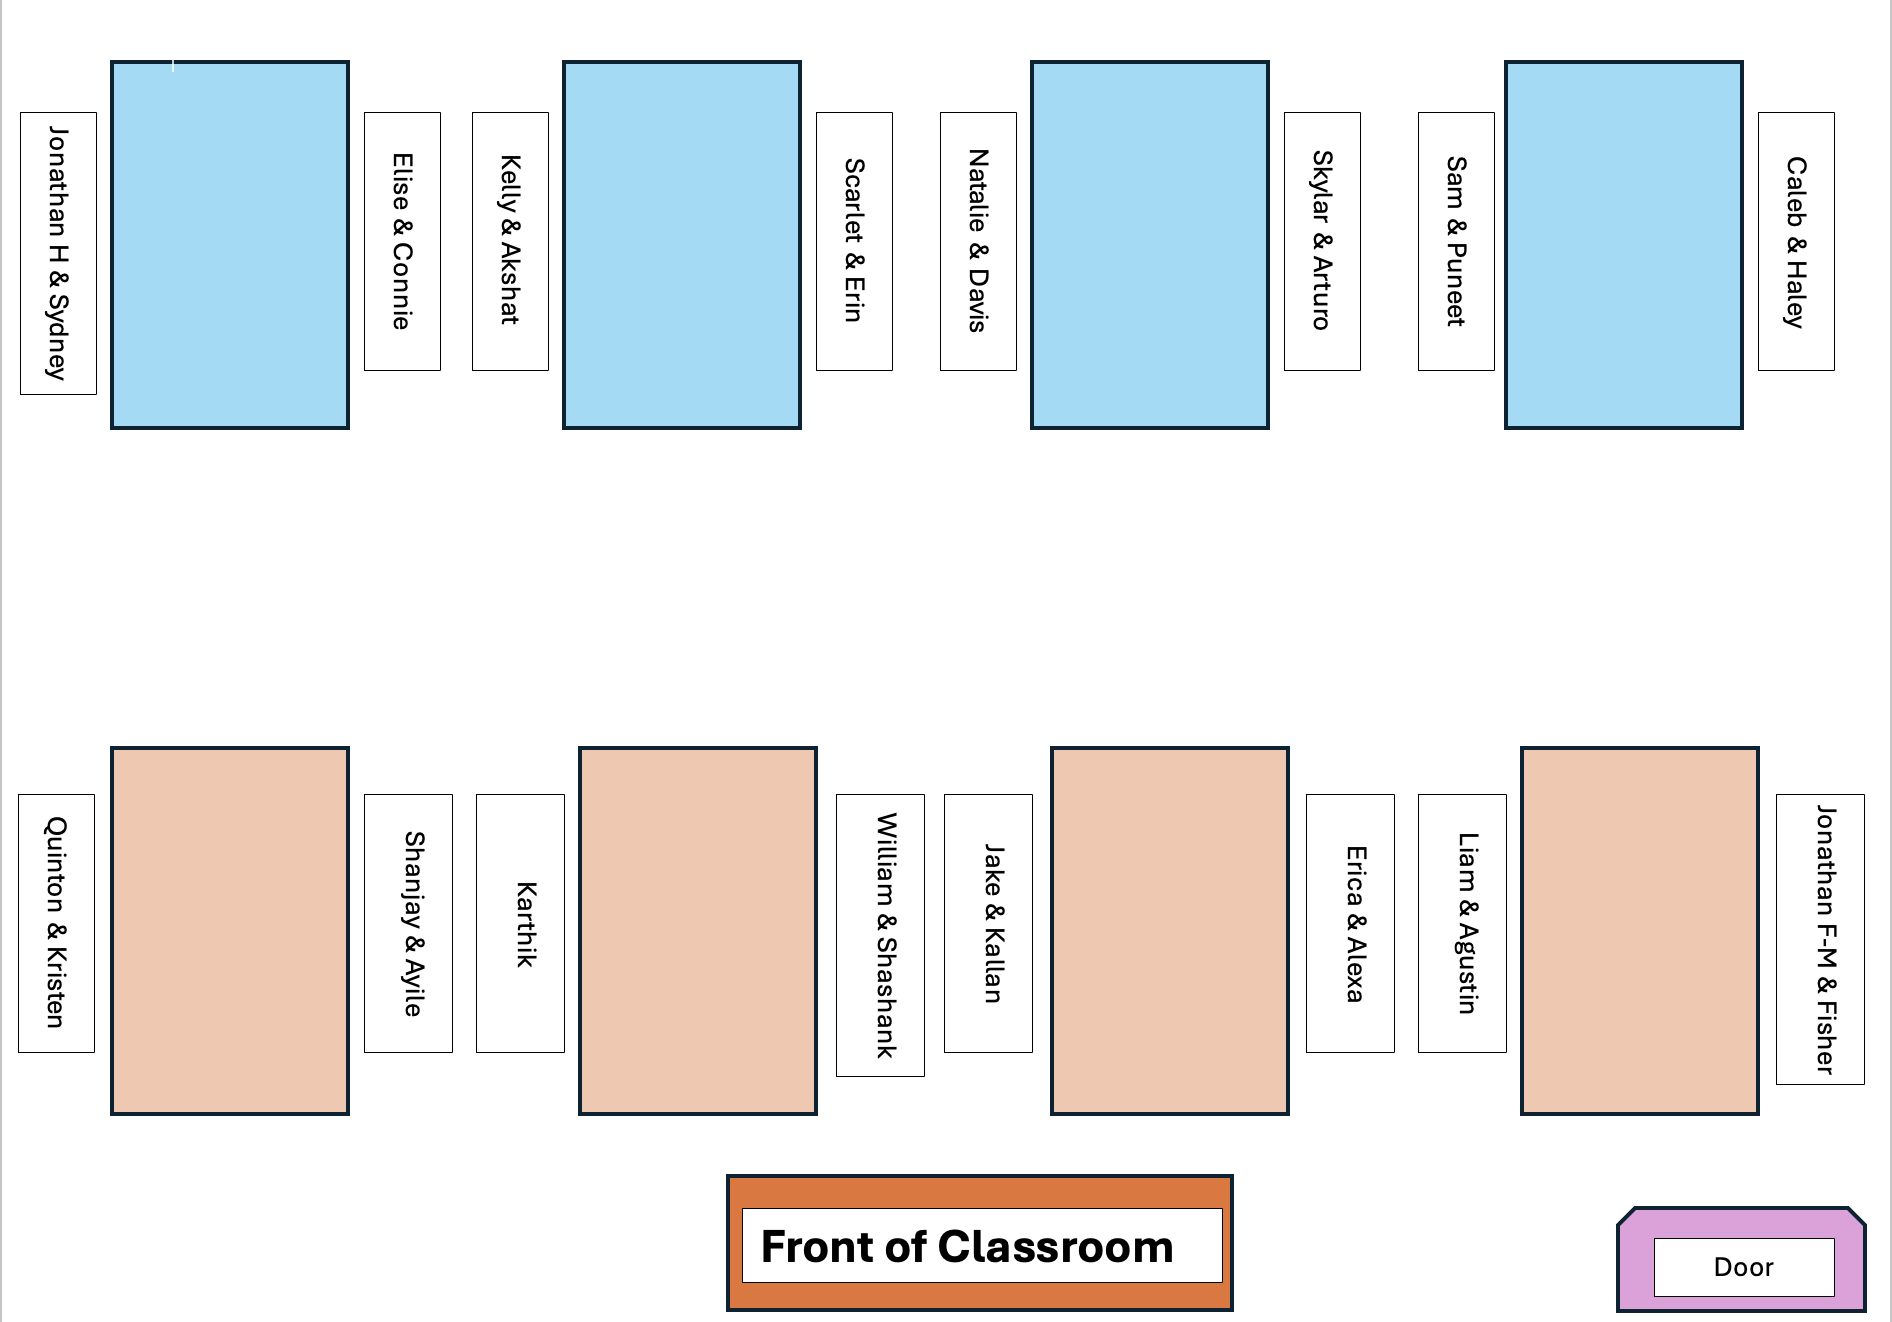
Task Cards
Section 71 (12:00 pm)
Accessing the Practice Activity in Google Colab
The partner whose family name starts first alphabetically starts as the Computer! The Computer needs to:
- Click on the Practice Activity 2 link from Canvas
- Log-in to your Google account
- Save a copy of the Colab notebook in your Google Drive
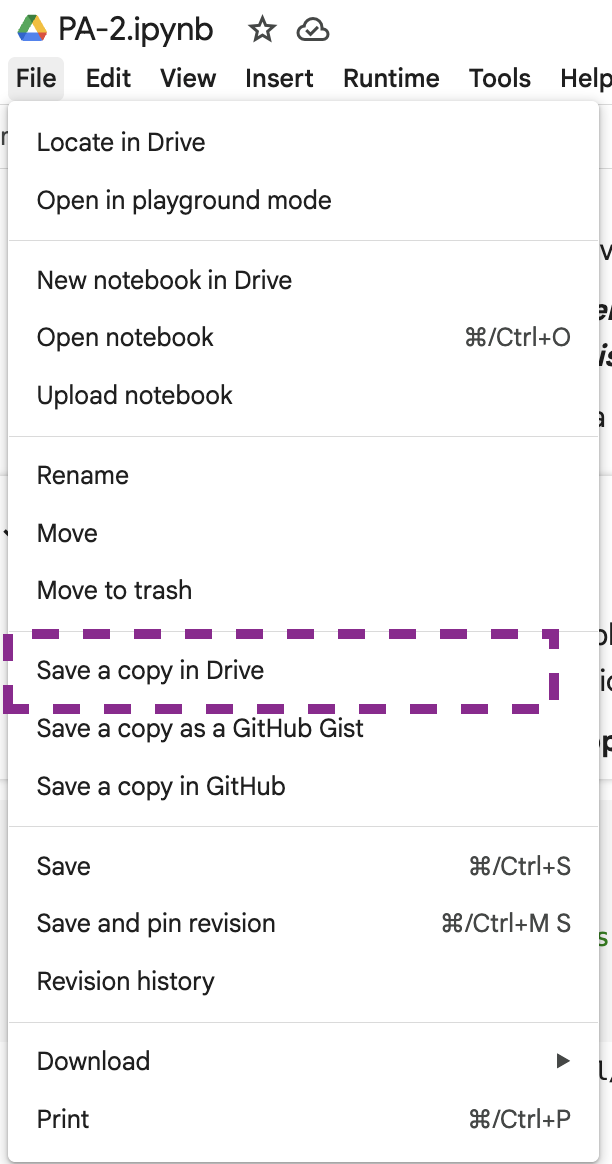
Sharing with Your Partner
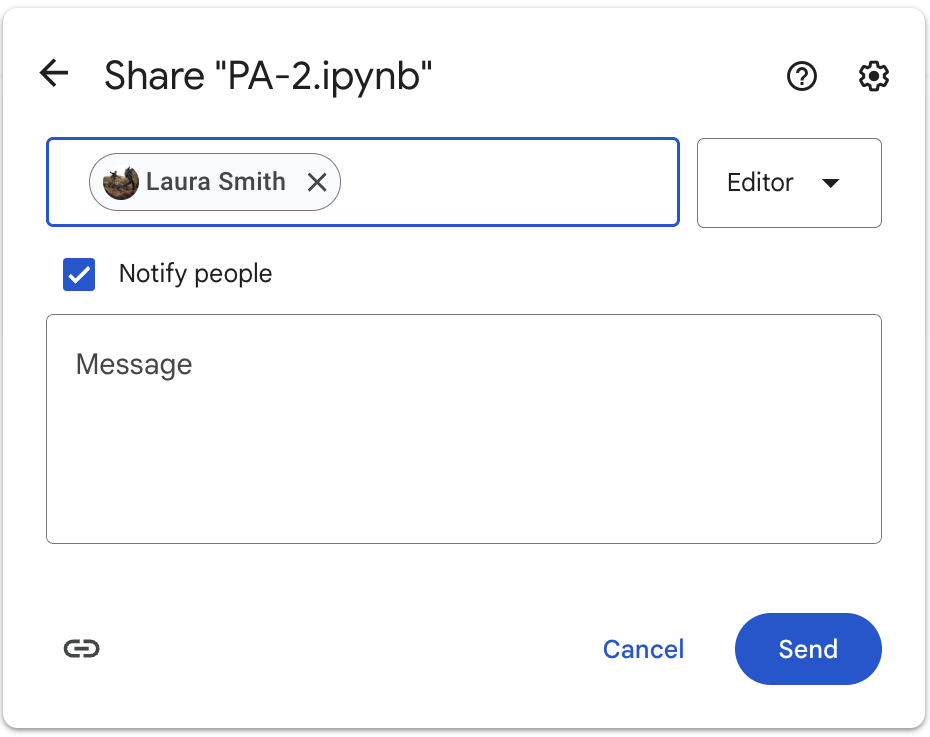
Once you have your copy, you need to:
- Share your copy with your partner’s Google account
- Make sure the Coder can open the file
- The Computer should plug their laptop into the monitor
- The Coder must close their computer
Things to Know About Colab
Only one person can type at a time
If two people type at the same time, only one document will be able to save.
This requires your group to adhere to the collaborative protocol!
Code that was run on one person’s computer will not appear on another person’s computer
When you switch roles, the new Computer will need to run all the code that was typed by the previous Computer.