Dummy Variables and Column Transformers
Activity 3.1
Fill vs Color for Scatterplots
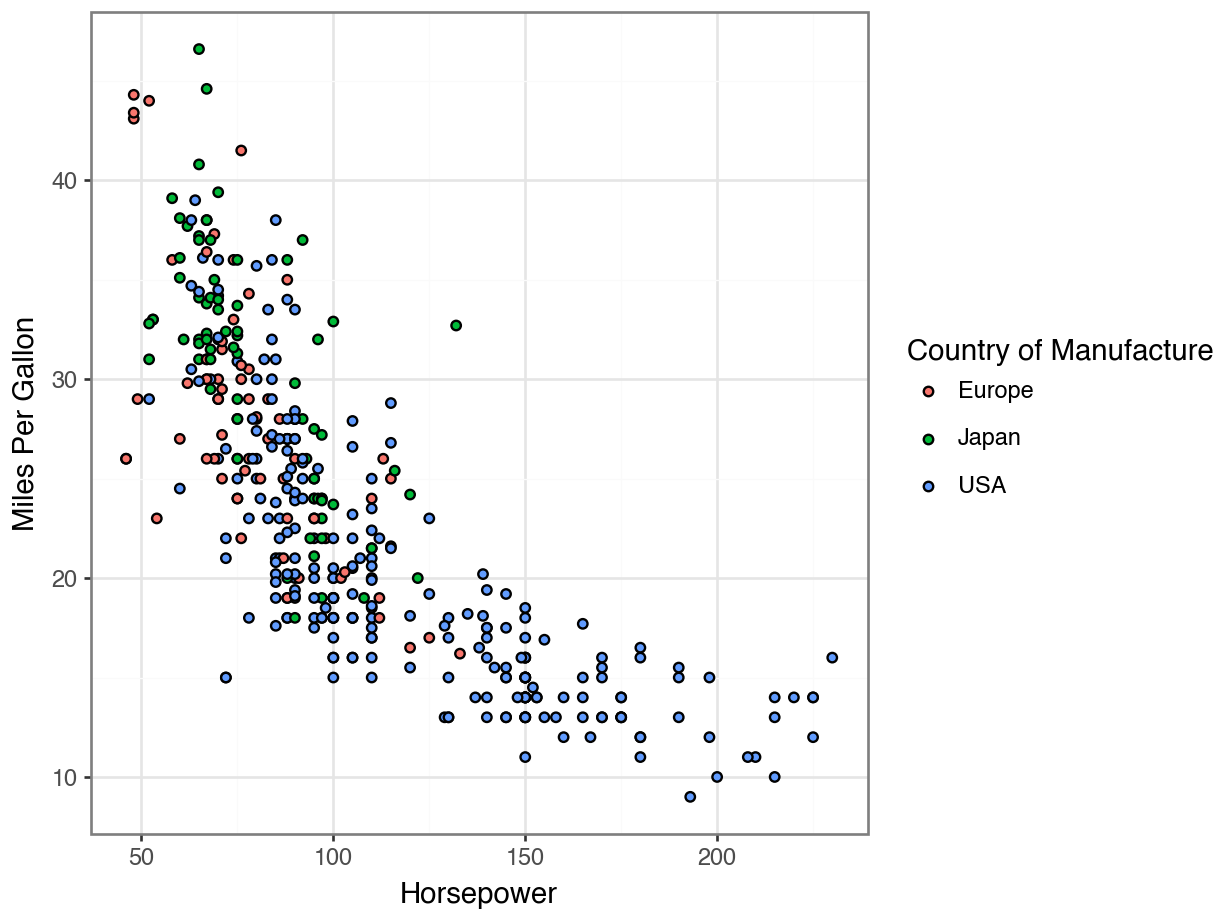
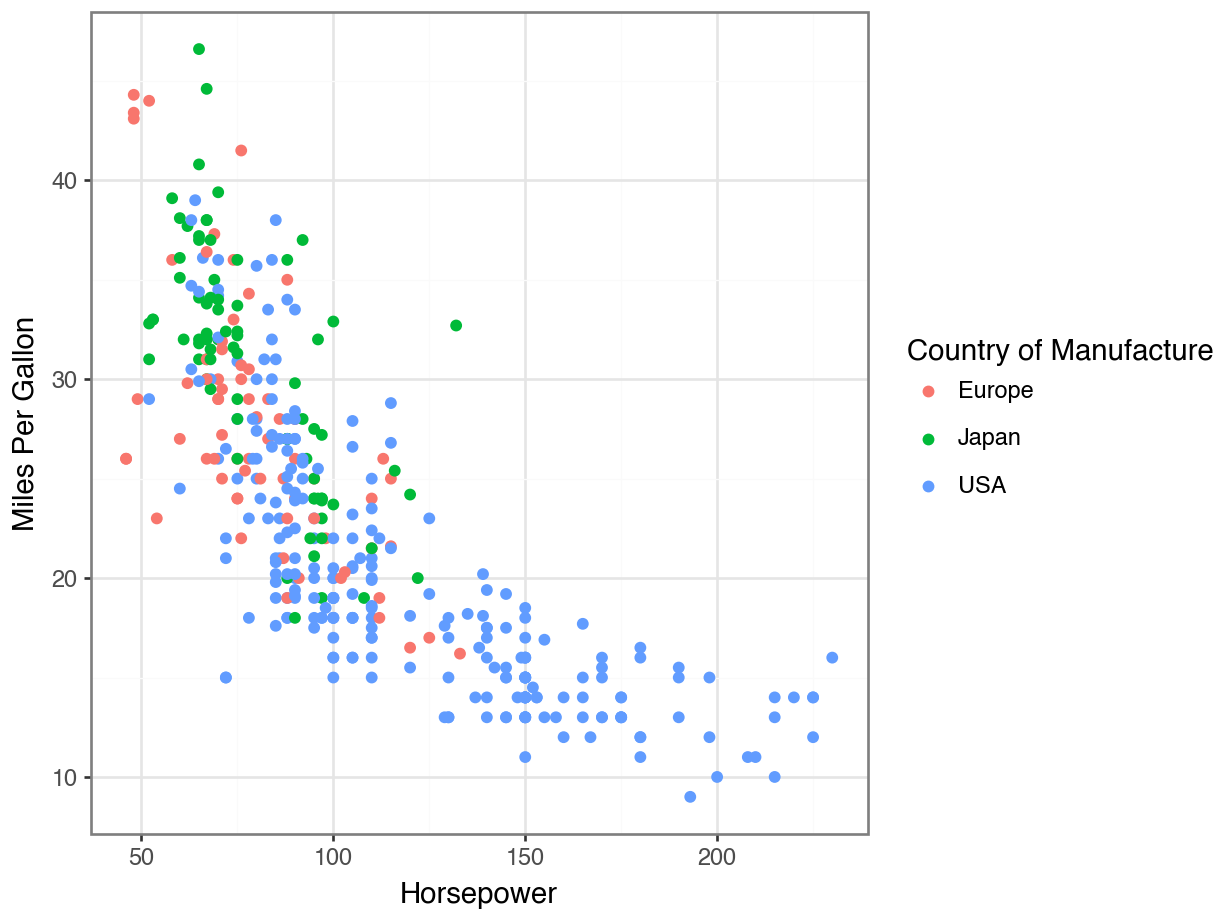
Nicely Formatted Axis Labels
Displaying Every Point

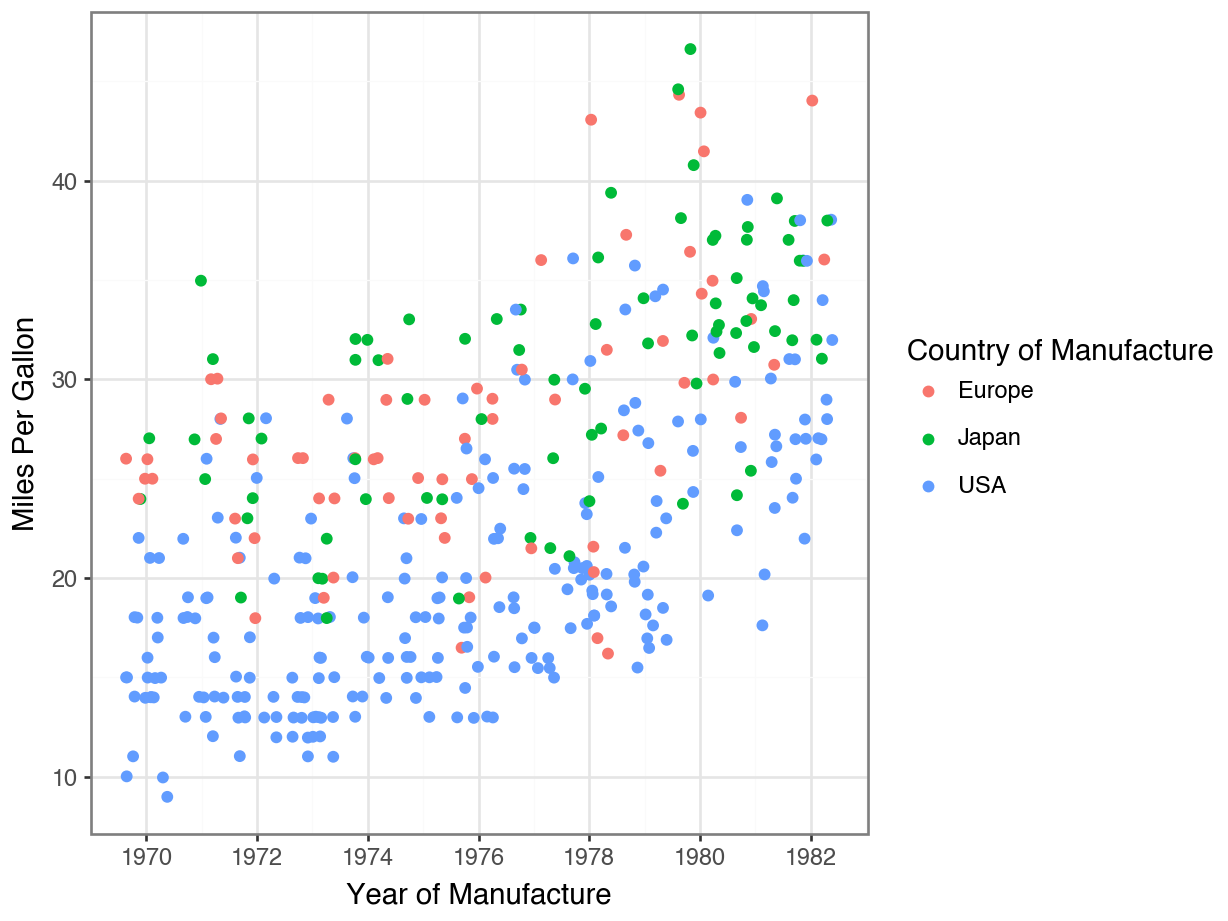
Redundant Legends
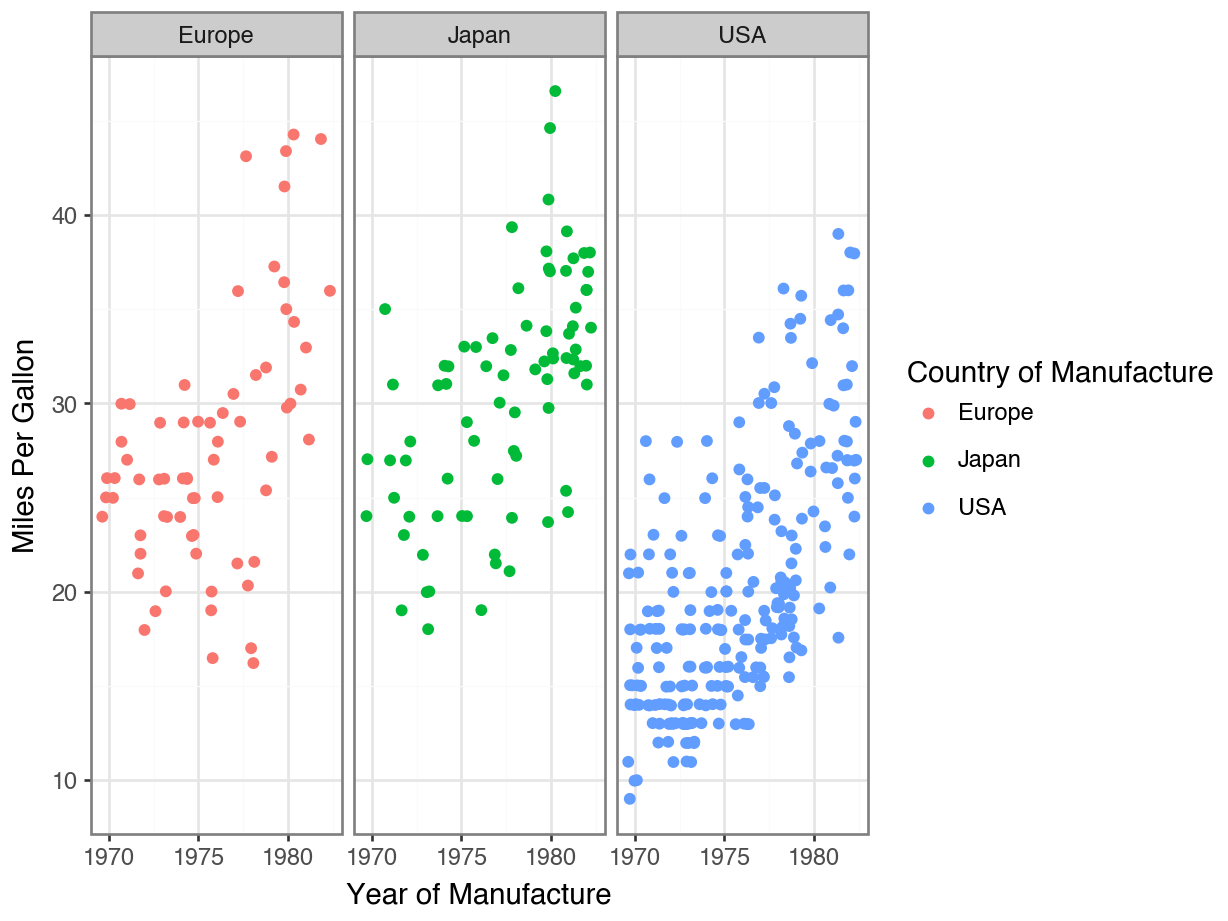
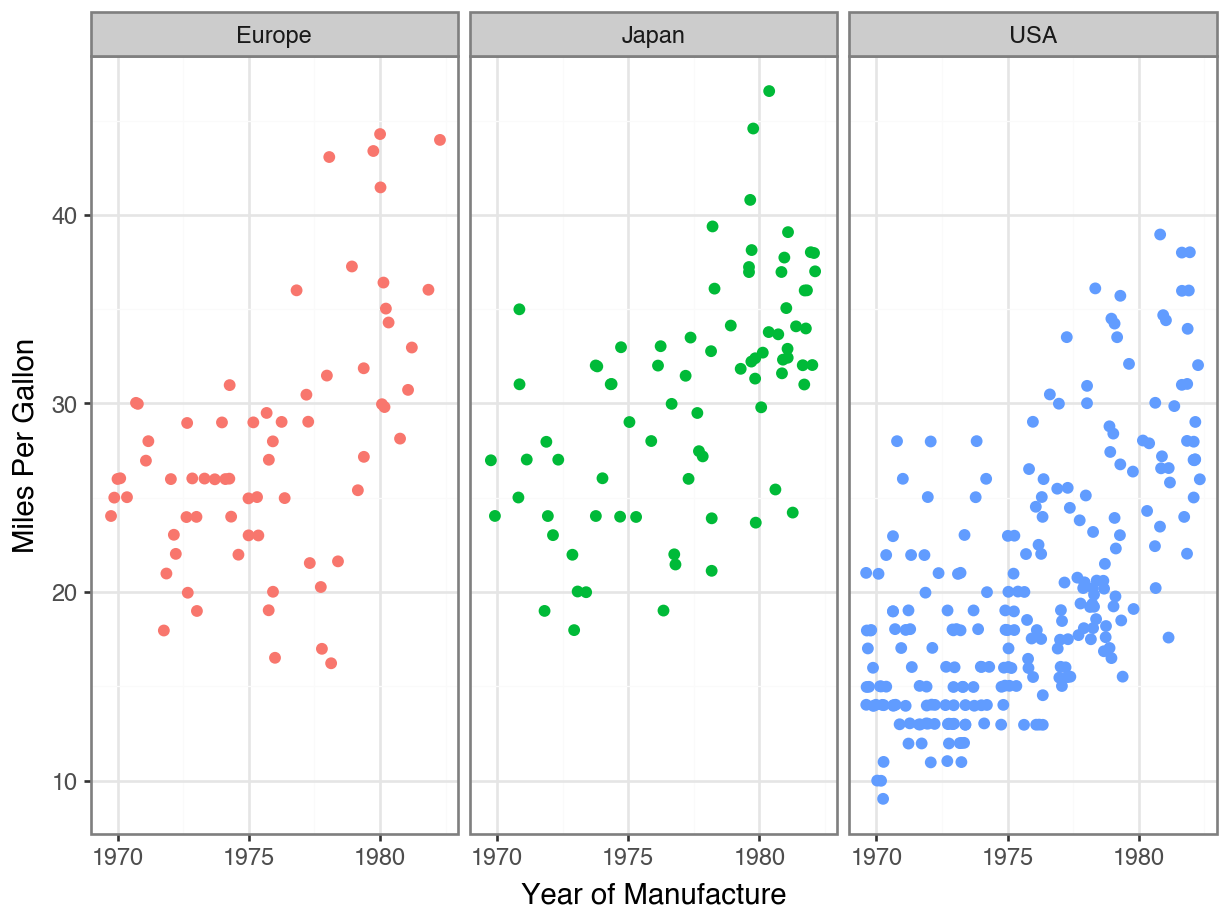
Removing Your Legend
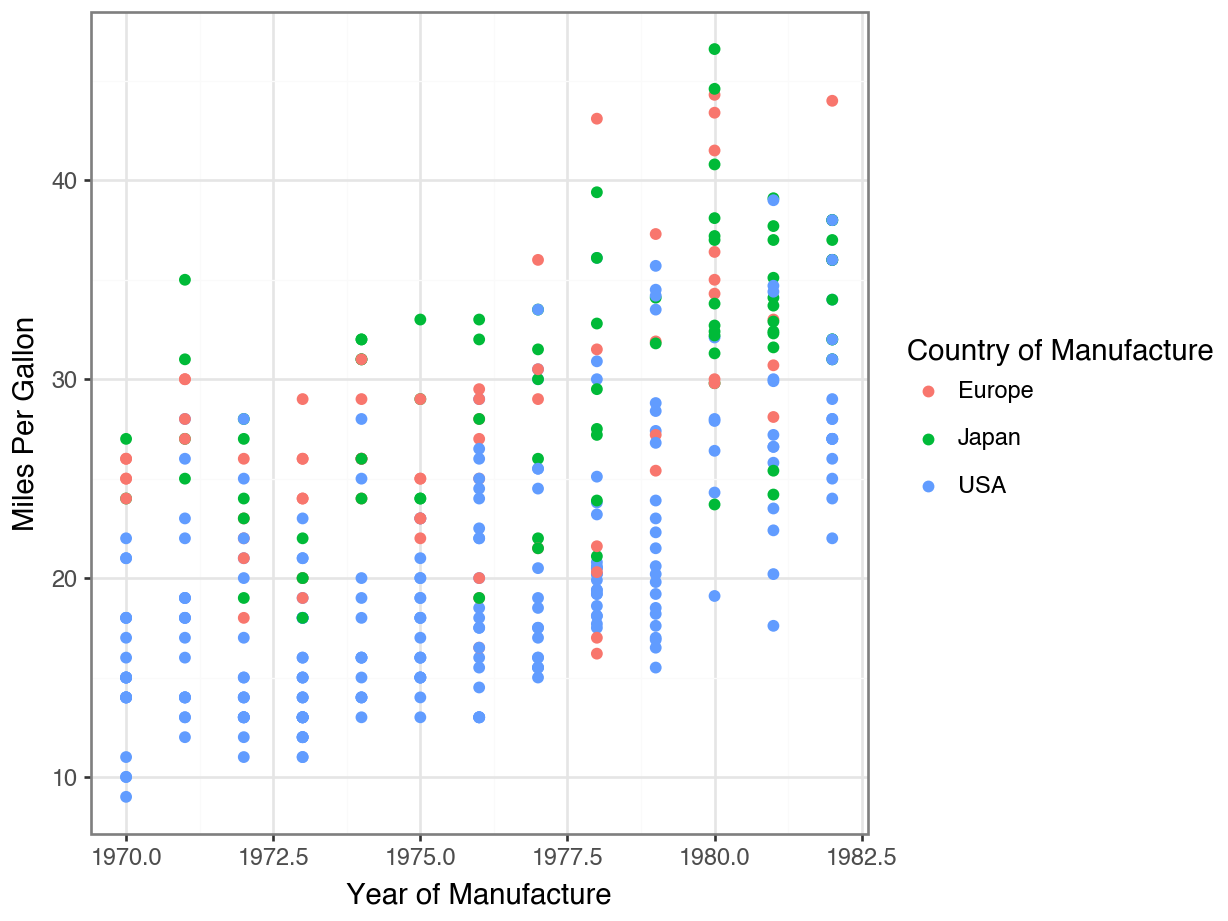
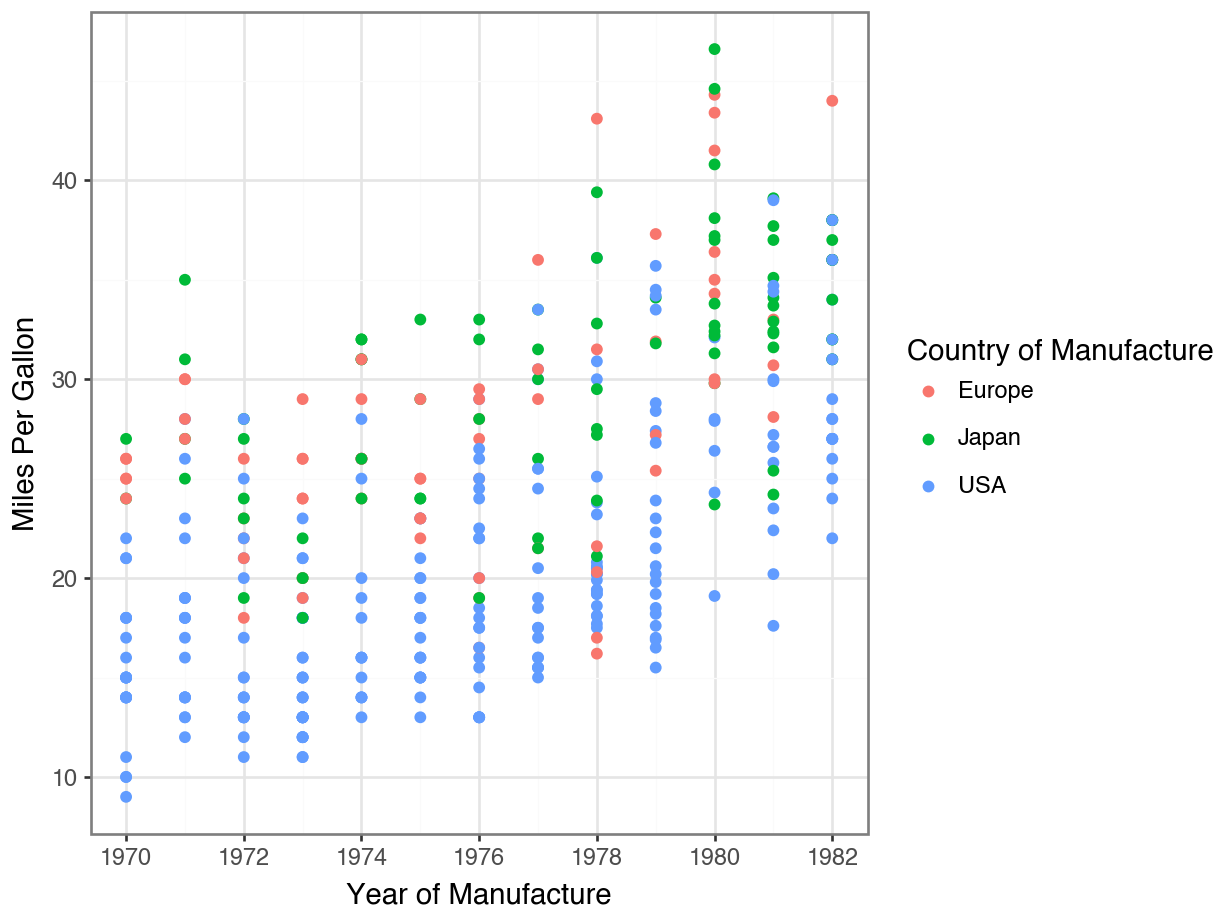
Code
(
    ggplot(df, mapping = aes(x = "model year",
                             y = "mpg",
                             color = "origin")
    ) +
    geom_jitter() +
    facet_wrap("origin") +
    theme_bw() +
    labs(x = "Year of Manufacture",
         y = "Miles Per Gallon",
         color = "Country of Manufacture") +
    scale_x_continuous(
        breaks = list(range(1970, 1985, 5)
        )
        ) +
    theme(legend_position = "none")
)
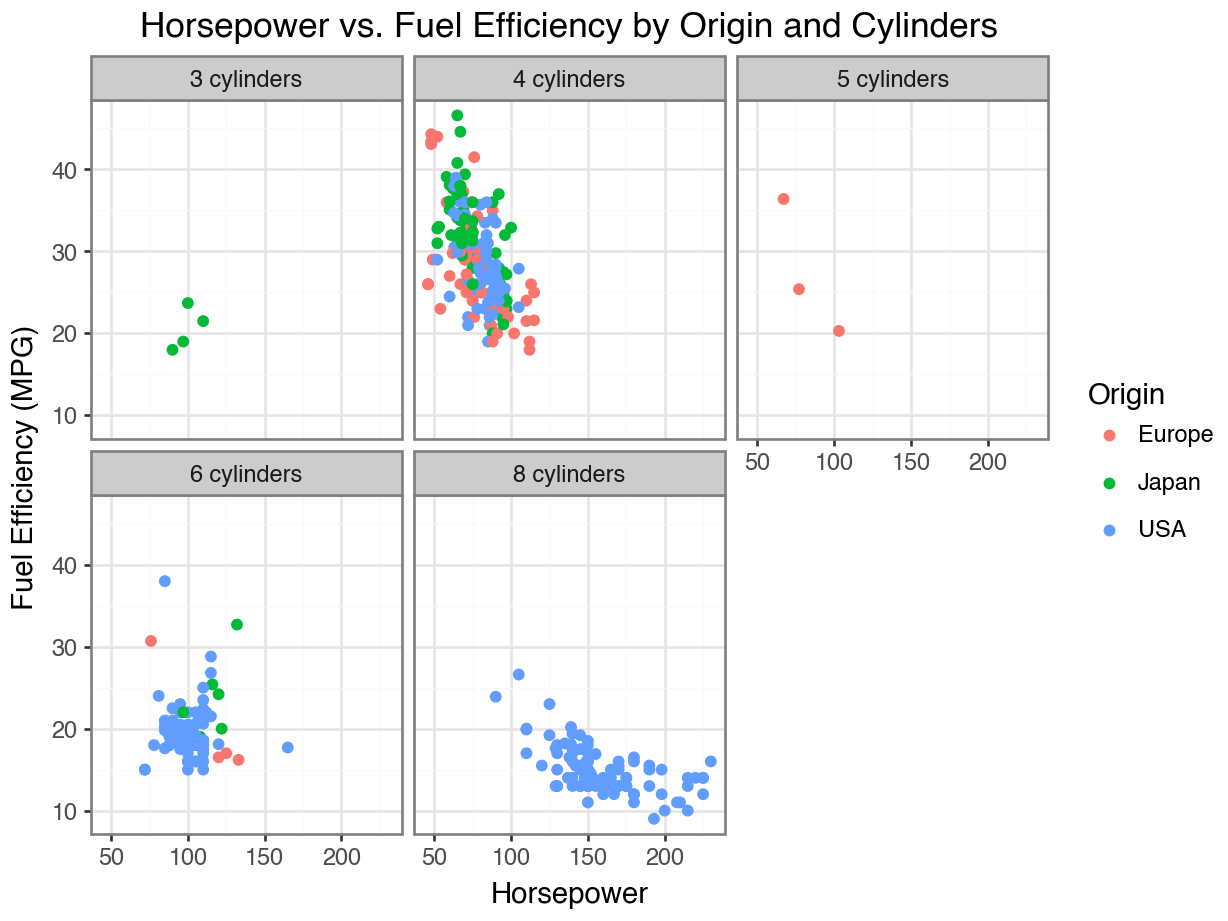
Adding Descriptive Labels to Facets
Code
(
    ggplot(df, aes(x = 'horsepower', y = 'mpg', color = 'origin'))
    + geom_point()
    + facet_wrap('~ cylinders', labeller = labeller(cylinders=lambda x: f'{x} cylinders'))
    + labs(title = 'Horsepower vs. Fuel Efficiency by Origin and Cylinders',
    x = 'Horsepower',
    y = 'Fuel Efficiency (MPG)', color = 'Origin')
    + theme_bw()
)
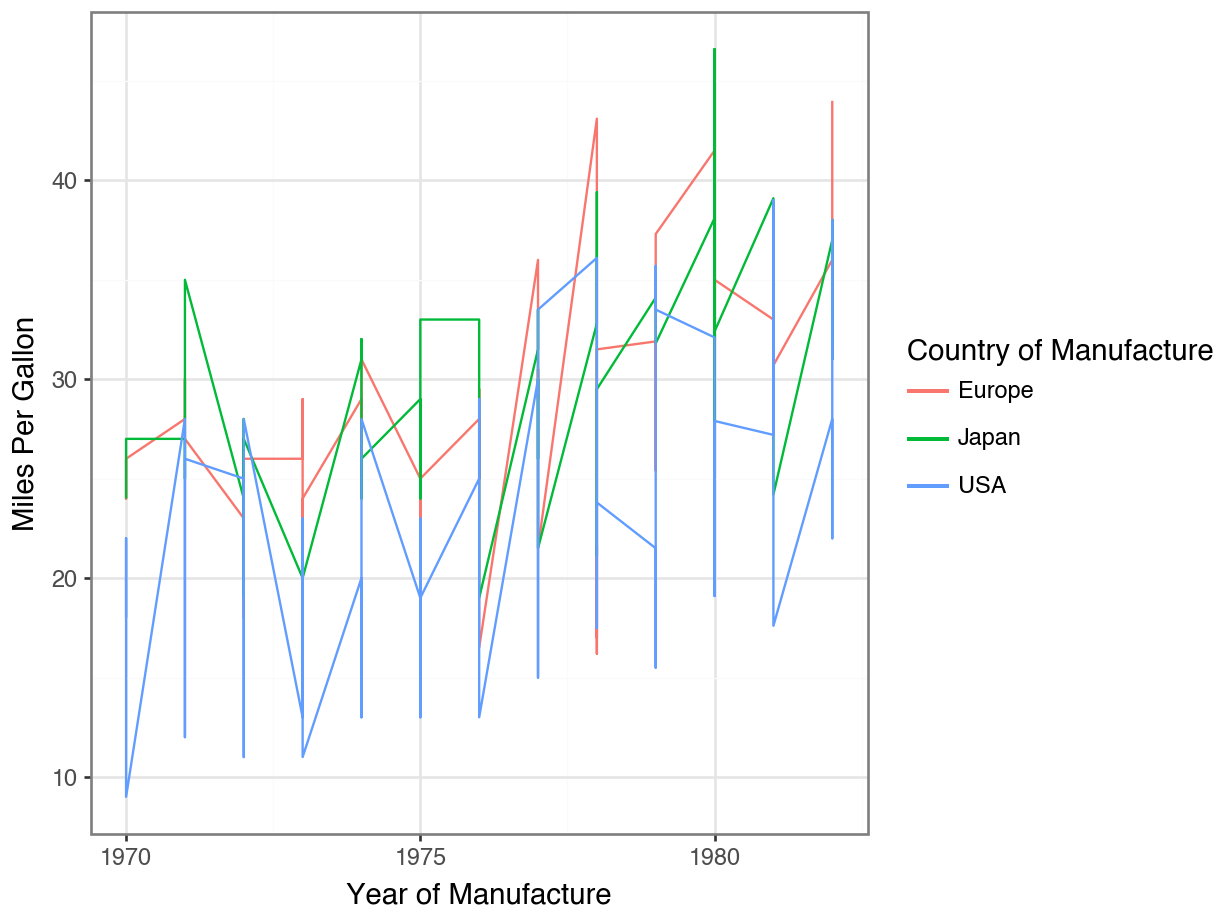
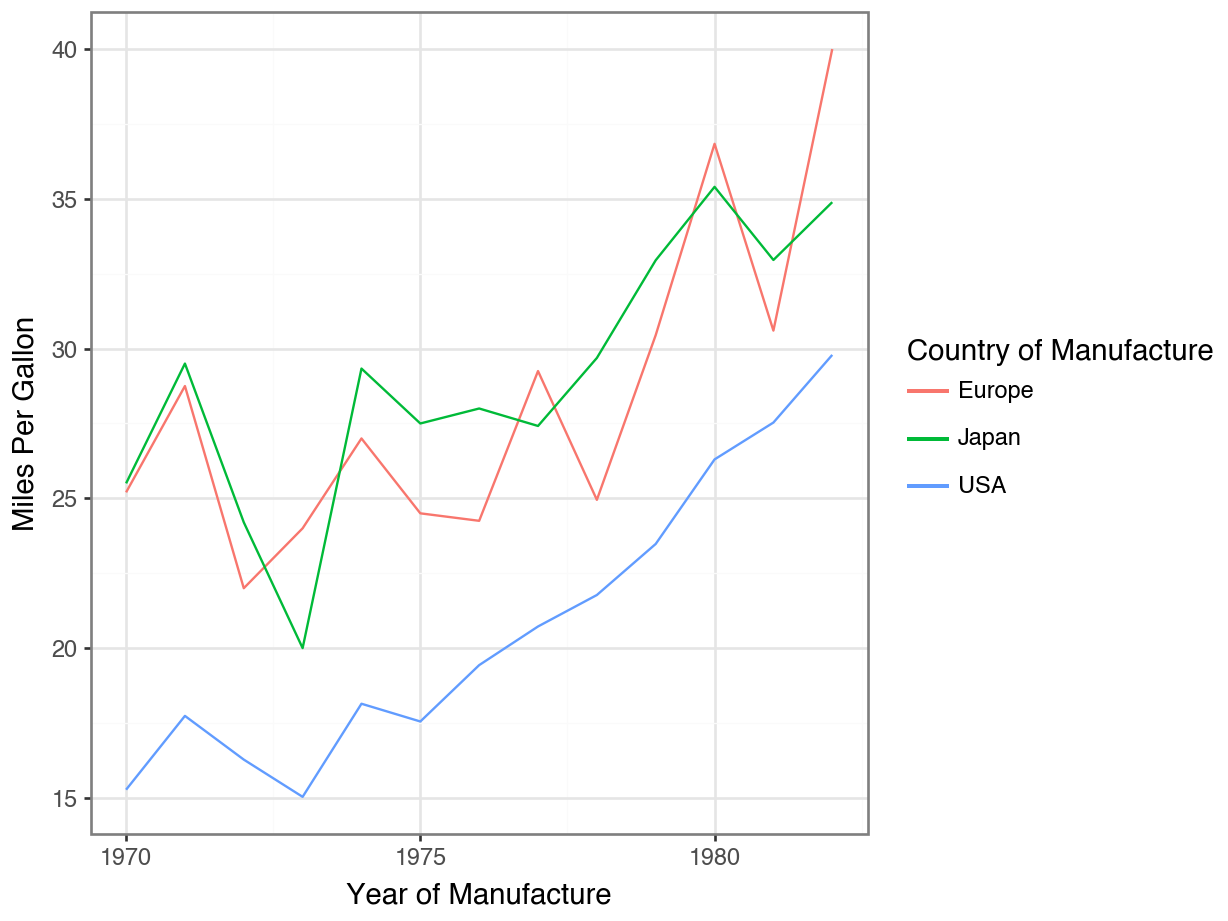
geom_line()
Code
year_means = (
    df
    .groupby(["model year", "origin"])["mpg"]
    .mean()
    .reset_index()
)

(
    ggplot(year_means, mapping = aes(x = "model year",
                                      y = "mpg",
                                      color = "origin")
    ) +
    geom_line() +
    theme_bw() +
    labs(x = "Year of Manufacture",
         y = "Miles Per Gallon",
         color = "Country of Manufacture") +
    scale_x_continuous(
        breaks = list(range(1970, 1985, 5)
        )
        )
)
The story last week…
Distances
We measure similarity between observations by calculating distances.
Euclidean distance: sum of squared differences, then square root
Manhattan distance: sum of absolute differences
scikit-learn
Use the pairwise_distances() function to get back a 2D numpy array of distances.
Scaling
It is important that all our features be on the same scale for distances to be meaningful.
Standardize: Subtract the mean (of the column) and divide by the standard deviation (of the column).
MinMax: Subtract the minimum value, divide by the range.
scikit-learn
Follow the specify - fit - transform code structure. In the specify step, you should use the StandardScaler() or MinMaxScaler() functions.
Recall: AMES Housing data
   Order        PID  MS SubClass  ... Sale Type  Sale Condition  SalePrice
0      1  526301100           20  ...       WD           Normal     215000
1      2  526350040           20  ...       WD           Normal     105000
2      3  526351010           20  ...       WD           Normal     172000
3      4  526353030           20  ...       WD           Normal     244000
4      5  527105010           60  ...       WD           Normal     189900

[5 rows x 82 columns]
Distances and Categorical Variables
What about categorical variables?
Suppose we want to include the variable Bldg Type in our distance calculation…
Bldg Type
1Fam      2425
TwnhsE     233
Duplex     109
Twnhs      101
2fmCon      62
Name: count, dtype: int64
Then we need a way to calculate \((\texttt{1Fam} - \texttt{Twnhs} )^ 2\).
Converting to Binary
Let’s instead think about a variable that summarizes whether an observation is a single family home or not.
is_single_fam
True     2425
False     505
Name: count, dtype: int64
What does a value of True represent? False?
Dummy Variables
When we transform a variable into binary (True / False), we call this variable a dummy variable or we say the variable has been one-hot-encoded.
Now we can do math!
Specify
Fit
StandardScaler()In a Jupyter environment, please rerun this cell to show the HTML representation or trust the notebook.
On GitHub, the HTML representation is unable to render, please try loading this page with nbviewer.org.
Parameters
Calculating Distances
Looking back…
Where have you seen one-hot-encoded variables already?
Let’s reset the dataset now…
Dummifying Variables
Dummifying Variables
What if we don’t just want to study
is_single_fam, but rather, all categories of theBldg Typevariable?In principle, we just make dummy variables for each category:
is_single_fam,is_twnhse, etc.Each category becomes one column, with 0’s and 1’s to show if the observation in that row matches that category.
That sounds pretty tedious, especially if you have a lot of categories…
Luckily, we have shortcuts in both
pandasandsklearn!
Dummifying in Pandas
      Bldg Type_1Fam  Bldg Type_2fmCon  ...  Bldg Type_Twnhs  Bldg Type_TwnhsE
0               True             False  ...            False             False
1               True             False  ...            False             False
2               True             False  ...            False             False
3               True             False  ...            False             False
4               True             False  ...            False             False
...              ...               ...  ...              ...               ...
2925            True             False  ...            False             False
2926            True             False  ...            False             False
2927            True             False  ...            False             False
2928            True             False  ...            False             False
2929            True             False  ...            False             False

[2930 rows x 5 columns]
Some things to notice here…
What is the naming convention for the new columns?
Does this change the original dataframe
df? If not, what would you need to do to add this information back in?What happens if you put the whole dataframe into the
get_dummiesfunction? What problems might arise from this?
Dummifying in sklearn
Specify
Fit
OneHotEncoder()In a Jupyter environment, please rerun this cell to show the HTML representation or trust the notebook.
On GitHub, the HTML representation is unable to render, please try loading this page with nbviewer.org.
Parameters
Dummifying in sklearn
Things to notice:
What object type was the result?
Does this change the original dataframe
df? If not, what would you need to do to add this information back in?What pros and cons do you see for the
pandasapproach vs thesklearnapproach?
Column Transformers
Preprocessing
So far, we have now seen two preprocessing steps that might need to happen to do an analysis of distances:
- Scaling the quantitative variables
- Dummifying the categorical variables
Preprocessing steps are things you do only to make the following analysis/visualization better.
- This is not the same as data cleaning, where you make changes to fix the data (e.g., changing data types).
- This is not the same as data wrangling, where you change the structure of the data (e.g., adding or deleting rows or columns).
Lecture 4.1 Quiz
Identify the following as cleaning, wrangling, or preprocessing:
Removing the
$symbol from a column and converting it to numeric.Narrowing your data down to only first class Titanic passengers, because you are not studying the others.
Converting a
Zip Codevariable from numeric to categorical using.astype().Creating a new column called
n_investmentthat counts the number of people who invested in a project.Log-transforming a column because it is very skewed.
Preprocessing in sklearn
- Unlike cleaning and wrangling, the preprocessing steps are “temporary” changes to the dataframe.
It would be nice if we could trigger these changes as part of our analysis, instead of doing them “by hand”.
This is why the specify - fit - transform process is useful!
We will first specify all our preprocessing steps.
Then we will fit the whole preprocess
Then we will save the transform step for only when we need it.
Column Transformers – Specify
Column Transformers – Fit
ColumnTransformer(remainder='passthrough',
                  transformers=[('onehotencoder', OneHotEncoder(),
                                 ['Bldg Type', 'Neighborhood'])])
In a Jupyter environment, please rerun this cell to show the HTML representation or trust the notebook. On GitHub, the HTML representation is unable to render, please try loading this page with nbviewer.org.
Parameters
['Bldg Type', 'Neighborhood']
Parameters
['Gr Liv Area', 'Bedroom AbvGr', 'Full Bath', 'Half Bath']
passthrough
Column Transformers – Transform
Things to notice…
What submodule did we import
make_column_transformerfrom?What are the two arguments to the
make_column_transformer()function? What object structures are they?What happens if you fit and transform on the whole dataset, not just
df[features]? Why might this be useful?
Lecture Activity 4.2
Try the following:
What happens if you change
remainder = "passthrough"toremainder = "drop"?What happens if you add the argument
sparse_output = Falseto theOneHotEncoder()function?What happens if you add this line before the transform step:
preproc.set_output(transform = "pandas")(keep thesparse_output = Falsewhen you try this)
Multiple Preprocessing Steps
Why are column transformers so useful? We can do multiple preprocessing steps at once!
Fit!
ColumnTransformer(transformers=[('standardscaler', StandardScaler(),
                                 ['Gr Liv Area', 'Bedroom AbvGr', 'Full Bath',
                                  'Half Bath']),
                                ('onehotencoder',
                                 OneHotEncoder(sparse_output=False),
                                 ['Bldg Type', 'Neighborhood'])])
In a Jupyter environment, please rerun this cell to show the HTML representation or trust the notebook. On GitHub, the HTML representation is unable to render, please try loading this page with nbviewer.org.
Parameters
['Gr Liv Area', 'Bedroom AbvGr', 'Full Bath', 'Half Bath']
Parameters
['Bldg Type', 'Neighborhood']
Parameters
Transform!
      standardscaler__Gr Liv Area  ...  onehotencoder__Neighborhood_Veenker
0                        0.309265  ...                                  0.0
1                       -1.194427  ...                                  0.0
2                       -0.337718  ...                                  0.0
3                        1.207523  ...                                  0.0
4                        0.255844  ...                                  0.0
...                           ...  ...                                  ...
2925                    -0.982723  ...                                  0.0
2926                    -1.182556  ...                                  0.0
2927                    -1.048015  ...                                  0.0
2928                    -0.219006  ...                                  0.0
2929                     0.989884  ...                                  0.0

[2930 rows x 37 columns]
Finding All Categorical Variables
What if we want to tell sklearn, “Please dummify every categorical variable.”? Use a selector instead of exact column names!
ColumnTransformer(remainder='passthrough',
                  transformers=[('standardscaler', StandardScaler(),
                                 <sklearn.compose._column_transformer.make_column_selector object at 0x30fe12c60>),
                                ('onehotencoder',
                                 OneHotEncoder(sparse_output=False),
                                 <sklearn.compose._column_transformer.make_column_selector object at 0x3093c1be0>)])
In a Jupyter environment, please rerun this cell to show the HTML representation or trust the notebook. On GitHub, the HTML representation is unable to render, please try loading this page with nbviewer.org.
Parameters
<sklearn.compose._column_transformer.make_column_selector object at 0x30fe12c60>
Parameters
<sklearn.compose._column_transformer.make_column_selector object at 0x3093c1be0>
Parameters
passthrough
Fit AND Transform!
      standardscaler__Gr Liv Area  ...  onehotencoder__Neighborhood_Veenker
0                        0.309265  ...                                  0.0
1                       -1.194427  ...                                  0.0
2                       -0.337718  ...                                  0.0
3                        1.207523  ...                                  0.0
4                        0.255844  ...                                  0.0
...                           ...  ...                                  ...
2925                    -0.982723  ...                                  0.0
2926                    -1.182556  ...                                  0.0
2927                    -1.048015  ...                                  0.0
2928                    -0.219006  ...                                  0.0
2929                     0.989884  ...                                  0.0

[2930 rows x 37 columns]
Think about it
What are the advantages of using a selector?
What are the possible disadvantages of using a selector?
Does the order matter when using selectors? Try switching the steps and see what happens!
Takeaways
Takeaways
We dummify or one-hot-encode categorical variables to make them numbers.
We can do this with
pd.get_dummies()or withOneHotEncoder()fromsklearn.Column Transformers let us apply multiple preprocessing steps at the same time.
- Think about which variables you want to apply the steps to
- Think about options for the steps, like sparseness
- Think about
passthroughin your transformer